With big data analytics we can quickly and efficiently comb through a mammoth store of data for many business insights that just keep coming.
There's little debate about which long-term themes should continue to drive technology spending. Cloud computing, Big Data analytics, social media, mobile, the Internet of Things (IoT), and cyber security top the list. In a previous edition of From the Yardarm, we delved into cloud computing (Transition to the Cloud: Do-or-Die Time For Laggards, 12/2014). In this essay, however, we introduce you to Big Data analytics.
Technology forecaster International Data Corporation (IDC) expects the global Big Data technology and services market to reach $16.9 billion in 2015. This would amount to a 39% compounded annual growth rate from 2010's $3.2 billion, and would clock in at seven times the growth pace of the world's overall information and communication market.
What is Big Data?
The term "Big Data" continues to evolve, but think of it as an amount of information so large and complex that it requires advanced tools and methods in order to analyze and interpret it for further use. It can be structured, semi-structured, or unstructured, with the unstructured portion growing fastest. Unstructured data doesn't reside neatly in a database, making it more difficult to cull for business clues. Examples of unstructured data include audio and video files, social media posts, emails, and log data. Imagine what Facebook will do with information gleaned from Instagram, or Google from YouTube, using the developing power of Big Data analytics.
Perhaps one can think about Big Data in a simpler way. In sixth grade science class, we devised experiments to prove or disprove a single hypothesis. With Big Data analytics, however, we can quickly and efficiently comb through a mammoth store of data for many business insights that just keep coming. Of course, another way to define Big Data analytics is to prioritize what its enterprise users do with it. World Wide Technology, Inc. provides an example from the auto insurance industry: In-vehicle sensors can collect real-time, unstructured data on driver behavior, such as miles driven, vehicle speed, etc., that can be compared to archived structured data, such as insurance claims, credit scores, etc., to more accurately estimate customer premiums and manage risk.
Big Data already is here. According to Siemens, we've stored one zettabyte — that's a one with 21 zeros behind it — which is 50 percent more than all the grains of sand on all the beaches on Earth. And the volume of this digital data may increase to 40 zettabytes by 2020, meaning it will more than double every year.

Of the five key industries in the technology sector, International Data Corporation (IDC) expects services and software, followed by storage, to receive the greatest amount of critical Big Data spending globally this year.

Incumbents racing to transition their technologies and business models to meet the Big Data challenge comprise most of Big Data's biggest revenue producers. At number one, IBM serves as a good example. The firm was founded in 1911. Its overall sales are expected to decline both this year and next, despite any Big Data success.
Many Big Data pure plays are upstart companies. San Francisco-based Splunk is one such emerging firm whose sales rank it among Big Data's top 12. Splunk's fiscal year ended January 2015 with 49% sales growth to $451 million. The Wall Street consensus predicts Splunk's revenue will rise another 37% this year to $616 million. Like many fledgling technology companies, Splunk invests aggressively in its business aiming to propel even greater top-line growth and, ultimately, profits and cash flow.
Another intriguing company is Seattle's Tableau Software, which specializes in interactive data visualization. Its unique software product called VizQL turns large data sets into interactive graphicdisplays that help end-users extract meaning and make decisions. Thefirm went public in 2013. Like Splunk, Tableau is growing like a weed in the field of Big Data analytics. In 2014, Tableau's sales rose 78% to $376 million. The consensus estimate is for 50% growth in 2015 to $618 million.
Of course, once a big opportunity like Big Data has been revealed, seemingly everyone jumps on the bandwagon. Even those that offer no solution to this problem will spin it that they saw the trend coming and are poised to capture it. We bet that you'll hear much more about Splunk, Tableau, and Big Data's winners and losers over the next few years.
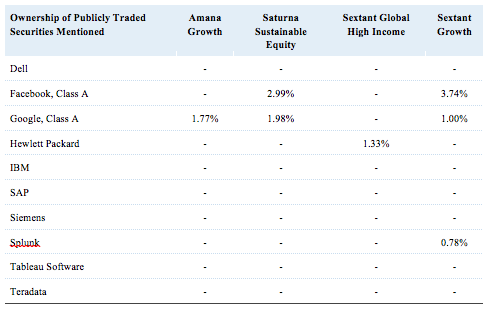
(As of June 30, 2015)
Security weightings are shown as a percentage of a Fund's total net assets. Amana Income, Amana Developing World, Idaho Tax-Exempt, Saturna Sustainable Bond, Sextant Bond Income, Sextant Core, Sextant International, and Sextant Short-Term Bond Funds did not own any securities of the companies mentioned.
Copyright 2015 Saturna Capital Corporation and/or its affiliates. All rights reserved. Vol. 9 · No. 5
Saturna Capital does not share subscriber information with third parties.
Important Disclaimers and Disclosures
This report is intended only for the information of the reader and is not to be used for or considered as an offer or the solicitation of an offer to sell or buy any securities or other financial instruments of any kind, including without limitation, any mutual fund or other product offered, sponsored, created, or managed by Saturna Capital Corporation or its subsidiaries or affiliates ("Saturna"). This report is not intended for distribution to, or use by, any person or entity who is a citizen or resident of, or located in, any locality, state, country, or other jurisdiction in which such distribution, publication, availability, or use would be contrary to law or regulation or which would subject Saturna to any registration or licensing requirement within such jurisdiction.
This document should not be considered as providing investment advice or services, or any other service offered by Saturna. Saturna may not have taken any steps to ensure that the securities referred to in this report are suitable for any particular investor. Saturna will not treat recipients as its customers by virtue of their reading or receiving the report.
Nothing in this report constitutes investment, legal, accounting, or tax advice or a representation that any investment or strategy is suitable or appropriate to a particular investor's circumstances or otherwise constitutes a personal recommendation to any investor. Saturna does not offer advice on the tax consequences of any investment.
All material presented in this report, unless specifically indicated otherwise, is under copyright to Saturna. None of the material, nor its content, nor any copy of it, may be altered in any way, transmitted to, copied, or distributed to any other party without the prior express written permission of Saturna. Unless otherwise indicated, all trademarks, service marks, and logos used in this report are trademarks or service marks of Saturna.
The information in this report was obtained from sources Saturna believes to be reliable, and Saturna believes the information and opinions in the material are accurate and complete as of the date of this material. However, information and opinions contained herein will change over time and without notice. Saturna has no obligation to update or amend any information or opinions at any time. Saturna makes no representations as to the accuracy or completeness of this material, nor does it have any responsibility to ensure that any other materials, including any containing materially different information, are brought to the attention of any recipient of this report.
Under no circumstances shall Saturna, its employees, or any affiliate be responsible for any investment decision by any recipient. This material is distributed on condition that it will not form the sole basis or a sufficient basis for any investment decision by any recipient. Any recipient who is not a market professional or institutional investor should seek the advice of an independent financial adviser prior to making any investment based on this report or for any necessary explanation of its contents.
Saturna does not provide tax, legal, or accounting advice. Investors should consult their own tax, legal, and accounting advisers before engaging in any transaction. In compliance with IRS requirements, recipients are notified that any discussion of US federal tax issues contained or referred to herein is not intended or written to be used for the purpose of (A) avoiding penalties that may be imposed under the Internal Revenue Code; nor (B) promoting, marketing, or recommending to another party any transaction or matter discussed herein.
The Dow Jones Industrial Average is a price-weighted index of 30 of the largest, most widely held US stocks. The S&P 500 is an index comprised of 500 widely held common stocks considered to be representative of the US stock market in general. The Russell 1000 Growth index is a widely recognized index of large-cap growth stocks. The Russell 2000 Index is comprised of US small cap stocks and measures the performance of the 2,000 smallest US companies in the Russell 3000 Index. The NASDAQ Composite index measures the performance of more than 5,000 US and non-US companies traded "over the counter" through the National Association of Securities Dealers Automated Quotation system. The MSCI EAFE Index, produced by Morgan Stanley Capital International, measures the equity market performance of developed markets in Europe, Australasia, and the Far East. The MSCI Emerging Markets Index, produced by Morgan Stanley Capital International, measures equity market performance in over 20 emerging market countries. Barclay's Capital US Aggregate Bond Index measures the performance of the US bond market.
All indices shown are widely recognized, unmanaged indices of common stock and bond prices that reflect no deductions for fees, expenses, or taxes. Investors cannot invest directly in the indices.
Past performance does not imply or guarantee future performance, and no representation or warranty, express or implied, is made regarding future performance. The price for, value of, and income from any of the securities or financial instruments mentioned in this report can fall as well as rise. The value of foreign securities and financial instruments is subject to exchange rate fluctuations that may have a positive or negative effect on the price or income of such securities or financial instruments. Investors in securities such as American Depositary Receipts – the values of which are influenced by currency volatility – effectively assume this risk.