The non-seasonally adjusted CPI was basically flat in July and 0.2% year-over-year. This is slightly below market expectations (Chart 1). In our last report, we stated that “with the recent weakness in oil prices and the renewed strength of the U.S. dollar, we would not be surprised to see weaker headline numbers in the next few months.” This is playing out like we expected.
Chart 1

The just released FOMC July meeting minutes also confirmed our view that the Fed is also concerned about the weak inflation picture. The mention of the US dollar as a headwind to inflation also echoed our concern about the tightening effect of a stronger dollar. The dollar real effective exchange rate and the 10-year real yield are great proxies for monetary conditions. Stronger dollar and higher real yields are both indications of tighter monetary conditions. Unfortunately, this is what is happening right now. In other words, the markets are doing the tightening job for the Fed. This is why we think the Fed would be much better off postponing the rate hike.
Chart 2

Despite the free-falling oil prices and inflation breakeven rates approaching the January low, there are still plenty of market professionals expecting higher inflation in the near to intermediate future. Chart 3 shows most inflation surveys are still showing an uptrend in inflation expectations while the market-based inflation breakeven rates have decidedly turned lower. We would side with the market every single time!
Chart 3

And we have not even mentioned the latest Chinese Yuan devaluation. No matter how you look at it, this is a significant disinflationary headwind. We have been concerned about the global disinflationary forces and this new development certainly adds to this concern.
The U.S. Core CPI (non-seasonally adjusted) was also flat month-over-month, slightly below expectations as well, and it was up 1.8% year-over-year (Chart 4). The latest core CPI forecast model reading (based on past CPI readings, Housing, Gold and CRB prices) remained firmly in the negative territory. The current inflation numbers are not yet reflective of the recent sell off in oil prices so we expect even weaker inflation going forward.
Although we believe the Fed is willing to raise rates as soon as September, we highly doubt it will be able to do that, given the disinflationary headwinds still present at this moment. Our base view for a rate hike is still December or later and asset markets have to behave well to make it possible. It’s entirely possible that the rate hike might be put off until 2016.
Chart 4

Selective CPI Subsets: Housing, Medical, And Transport
Chart 5
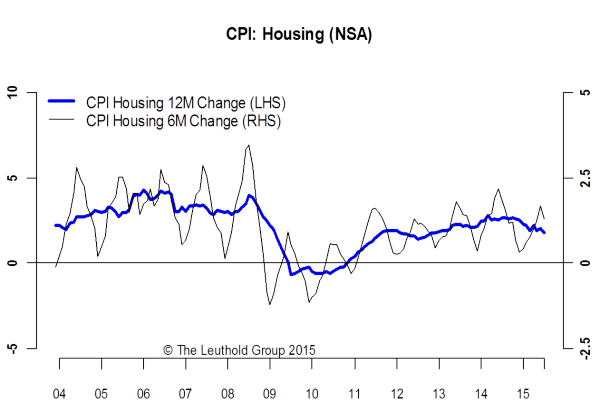
Housing Inflation Remained Healthy: Housing is 43% of the overall index, and its biggest component. It was up 1.7% from a year ago in July (Chart 5). The pace of housing inflation has slowed in the last six months. Although the overall housing inflation picture is still very healthy, its contribution to the overall CPI is waning. We need to see more inflationary support from other components.
Chart 6

Medical Inflation Slowed Too: This subset is 6.4% of the overall index. Its year-over-year pace slowed to 2.4% in July (Chart 6). Although still much higher than the overall index and the slower pace means its contribution to the overall inflation level is reduced. We expect this component to stay range bound at a higher level than the overall index.
Chart 7
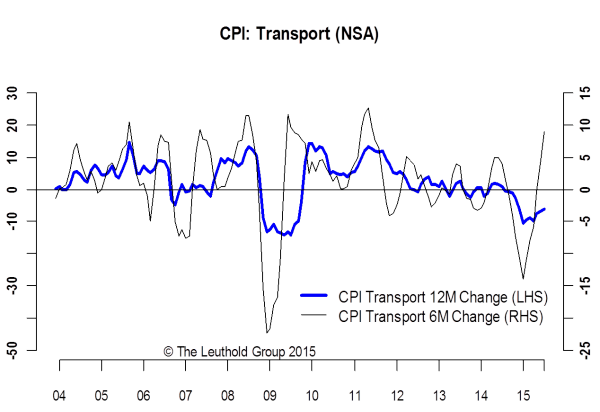
Transport Inflation Recovered From Low Levels: The Transportation subset, 15.3% of the overall index, was down –6.2% year over year in July, slightly better than the –6.9% in June (Chart 7). This is still reflecting the lagged effect of a Q2 rebound in oil prices but the renewed weakness in oil prices will certainly drive this component lower in the next few months.
PPI Inflation: July Reading –2.6% Y/Y
Chart 8
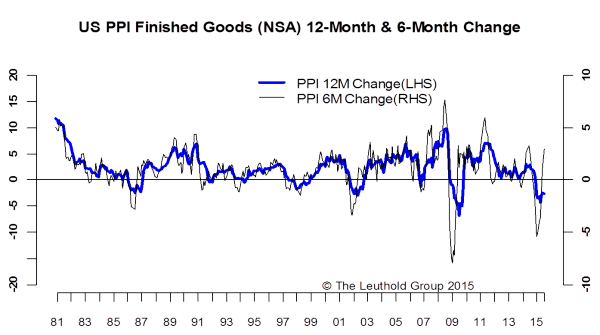
Although slightly better than expectations, the 12-month rate of change for the non-seasonally adjusted Finished Goods PPI remains deep in the negative territory at –2.6% in July (Chart 8). The down trend in producers inflation has decelerated but we expect it to go lower before it starts to go up again.
PPI Intermediate Materials: July Reading –6.6% Y/Y
Chart 9

Non-seasonally adjusted Intermediate Goods PPI was down –6.6% year over year in July, another very weak number. The six-month rate turned positive at 0.7% but we expect this to be very short-lived (Chart 9). The effect of the lower oil prices is yet to be reflected in this index.
PPI Crude Materials: July Reading –22.7% Y/Y
Chart 10

Crude material prices are also down sharply year-over-year in July (-22.7% —Chart 10). There have been six consecutive year-over-year declines of over –20%.
We expect this index to turn even lower as commodity weakness gets priced in. Oil does not look like it will find a bottom anytime soon so we are lowering our expectations for producers’ inflation.
© Leuthold Weeden Capital Management