KEY TAKEAWAYS
We continue to expect stocks to navigate the eventual start of the Fed rate hike cycle with the benefit of a continued U.S. economic expansion and earnings gains in the months ahead.
Although Fed stimulus and low interest rates have played a role in fueling the current bull market, earnings growth has been a far bigger factor.
The Federal Reserve’s (Fed) decision not to raise interest rates at its September 17 policy meeting was undoubtedly the biggest event of last week. Although not a big surprise, besides Donald Trump (and perhaps China), the Fed is all that anyone is talking about these days. This week we share some of our perspective on what the Fed’s decision may mean for the stock market and offer some investment ideas.
Some Perspective
All else equal, whether the Fed hikes rates now or three months from now should not matter too much for global financial markets. The move—when it comes—will likely be just 25 basis points (0.25%) based on recent communication from the Fed. In Fed Chair Yellen’s September 17, 2015, press conference, she indicated, “And once we begin to remove policy accommodation, we continue to expect that economic conditions will evolve in a manner that will warrant only gradual increases in the target federal funds rate.” Historically, gradual increases have been 25 basis points. We do not anticipate big moves in the interest rates that impact consumer and business borrowing costs, whether the Fed had hiked in September 2015 or waits until October 2015, December 2015, January 2016, or even March 2016. And while we acknowledge that Fed stimulus and low interest rates have played a role in fueling the now six-and-a-half-year-old bull market, we argue that earnings growth has been a far bigger factor.
Fed Fears Overdone?
Given recent stock market volatility, reviewing the historical relationship between the Fed and the stock market may provide some reassurance for those who may be worried that the Fed’s caution means it knows something that we don’t. Going back nine economic cycles since 1950, eight of nine times the S&P 500 rose over the year after the first Fed rate hike with an average gain of about 10% [Figure 1]. The one instance when stocks fell after the first rate hike was in the early 1970s, certainly a very different environment than the one we are in today, with skyrocketing inflation and a shortage of oil.
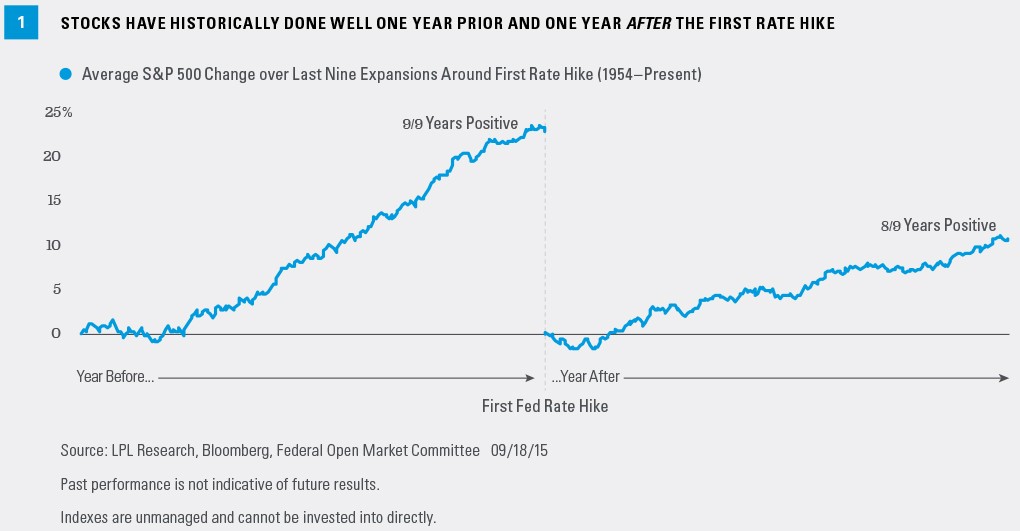
Because stocks have not performed well over the past year, some catch-up may be in order. The S&P 500 is down 2.6% over the past 12 months (as of September 18, 2015), a sharp contrast to the average 20% (or more) gain the year before the Fed’s first rate hike, as shown in Figure 1. So either stocks will have to rally through year-end or the Fed may have to start raising rates even later to achieve anything remotely close to the stock market’s historical average after the Fed’s initial rate hike. That said, it may be prudent to temper expectations given the Fed’s first rate hike is coming later in this economic cycle relative to prior cycles.
Some other factors suggesting a possible strong finish to 2015 for stocks:
1) The U.S. economy remains healthy. We expect the U.S. gross domestic product (GDP) to grow by 2.5–3% in the third quarter of 2015, with only a marginal impact from slower growth in China and related market volatility. Data on the biggest piece of the economy, consumer spending, have been resilient in recent weeks and the back to school shopping season generally met expectations. Retail sales rose a very respectable 4% year over year in August 2015, excluding gasoline and (strong) auto sales.
2) Earnings season is approaching. Earnings season has generally been a favorable period for stocks in recent years. We expect this upcoming earnings season to help ease China fears given limited company exposure, even though growth continues to be depressed by low oil prices and a strong U.S. dollar.
3) The stock market tends to like the fourth quarter. This is one of the strongest seasonal trends in the stock market. Since 1980, the S&P 500 is up during 80% of fourth quarters, with an average return of 4.4% (median 5.5%).
Earnings Drive Stock Prices
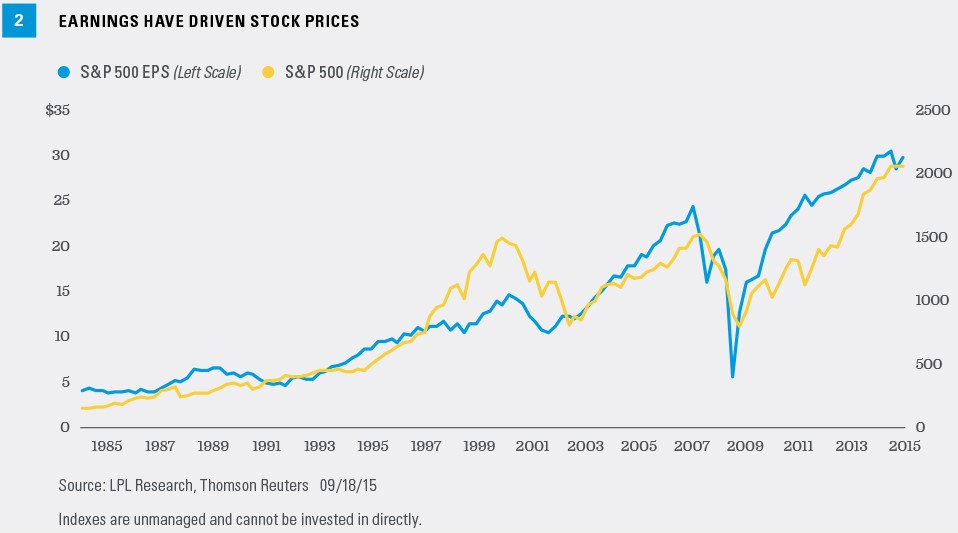
Some claim that the Fed’s quantitative easing program and zero interest rate policy is responsible for driving much of the stock market’s gains during the ongoing bull market. We argue that earnings growth has been a far bigger factor, evident in Figure 2. The figure shows the path of the S&P 500 overlaid on top of the path of S&P 500 earnings per share (EPS) since 1984. The similar paths demonstrate that earnings have supported the gains in stock prices. Although earnings are depressed currently, we expect earnings growth to accelerate in late 2015 and into 2016, which may help boost stocks late this year. Thomson Reuters consensus for 2016 S&P 500 earnings growth stands at 11%.
“Lower For Longer” Investing Implications
We do not believe the Fed’s decision last week warrants any changes to our suggested intermediate- to long-term equity allocations, but the Fed’s “lower for longer” policy stance may impact these interest rate–sensitive equities:
· Real estate investment trusts (REIT). REITs tend to perform well when interest rates are low or falling. We view the U.S. economic backdrop for real estate as favorable, but valuations are above average and we continue to expect rising long-term interest rates over the next several months (and probably longer) to present a headwind for REITs’ relative performance. We still see REITs as a reasonable choice for income-oriented investors.
· Master limited partnerships (MLP). MLPs have been more oil price sensitive than interest rate sensitive in recent months, and therefore, may not respond much to the Fed delaying its first rate hike. We suggest using MLPs for income investors expecting higher oil prices (generally our expectation), but REITs or utilities may be a better way to express a view on the Fed or interest rates through equities.
· Utilities. The utilities sector exhibits a high degree of interest rate sensitivity due to the sector’s high and historically stable yields. We believe the sector is expensive on a relative price-to-earnings basis and is unlikely to fully capture the market’s gains should a late-year rally occur due to its defensive characteristics. We favor cyclical sectors given the solid U.S. economic backdrop.
· Banks. Lenders benefit from a steep yield curve (when long-term interest rates are higher than short-term rates), which creates a wide gap between the banks’ cost of funds and rates earned on loans. As a result, banks may experience near-term weakness because the Fed is holding rates lower for longer. The Fed does not directly influence long-term interest rates but, by influencing short-term rates, growth, and inflation expectations, may exert downward pressure on long rates and cause the yield curve to flatten.
Investing in real estate/REITs involves special risks, such as potential illiquidity, and may not be suitable for all investors. There is no assurance that the investment objectives of this program will be attained. Investing in MLPs involves a high degree of risk including risks related to cash flow, dilution and voting rights. MLPs may trade less frequently than larger companies due to their smaller capitalizations which may result in erratic price movement or difficulty in buying or selling. MLPs are subject to significant regulation and may be adversely affected by changes in the regulatory environment including the risk that an MLP could lose its tax status as a partnership. Additionally high management fees and other expenses are associated with investing in MLP funds. Bank loans are loans issued by below investment-grade companies for short-term funding purposes with higher yield than short-term debt and involve interest rate, credit/default, and liquidity risks. Commodity-linked investments may be more volatile and less liquid than the underlying instruments or measures, and their value may be affected by the performance of the overall commodities baskets as well as weather, disease, and regulatory developments.
Turning to commodities, precious metals may garner some support from the Fed’s patience. Low short-term interest rates make gold cheaper to hold (because it pays no interest there is an opportunity cost with higher interest rates), put downward pressure on the U.S. dollar (which makes gold cheaper for non-U.S. buyers), and Fed stimulus may eventually be inflationary (gold is a popular inflation hedge). Gold may be a good short-term trade, but we would expect the window for this potential opportunity to be short lived, as Fed rate hikes are almost certainly coming within the next three to six months.
Because of its narrow focus, investing in a single sector, such as energy or manufacturing, will be subject to greater volatility than investing more broadly across many sectors and companies.
Conclusion
The Fed news was the big story of last week, perhaps trumping even Donald Trump. Although the debate over when the Fed will hike rates may be getting more attention than it deserves, it does impact markets. We continue to expect stocks to navigate the eventual start of the Fed rate hike cycle with the benefit of a continued U.S. economic expansion and earnings gains in the months ahead.
IMPORTANT DISCLOSURES
The opinions voiced in this material are for general information only and are not intended to provide specific advice or recommendations for any individual. To determine which investment(s) may be appropriate for you, consult your financial advisor prior to investing. All performance referenced is historical and is no guarantee of future results.
The economic forecasts set forth in the presentation may not develop as predicted and there can be no guarantee that strategies promoted will be successful.
Investing in stock includes numerous specific risks including: the fluctuation of dividend, loss of principal, and potential liquidity of the investment in a falling market.
All investing involves risk including loss of principal.
The PE ratio (price-to-earnings ratio) is a measure of the price paid for a share relative to the annual net income or profit earned by the firm per share.
INDEX DESCRIPTIONS
The Standard & Poor’s 500 Index is a capitalization-weighted index of 500 stocks designed to measure performance of the broad domestic economy through changes in the aggregate market value of 500 stocks representing all major industries.


