Still, in the wake of the sell-off, which in our opinion is driven by energy weakness and a back-up in bond yields, we see real opportunity: Yields on MLPs are now exceptionally high, and we believe distributions will grow in the mid-single digits for the rest of the year. We provide more details below.
Still a Niche Asset Class
The popularity of MLPs as an investment has exploded over the past decade. This is not surprising to us, as MLPs offer favorable tax deferred income to certain investors, which is particularly meaningful in an environment where U.S. Treasury yields have fallen to record lows. Despite the torrid growth (there are currently more than 130 MLP issuers accounting for around $400 billion in market capitalization), the MLP segment still remains a fairly small investment category and is a fraction of the S&P 500’s total market cap, which is around $18 trillion.
As is well known, the bulk of MLPs operate energy infrastructures assets, commonly known as ‘mid-stream’ activities in the energy production value chain. More than 90% of the Alerian MLP Index consists of natural gas and petroleum transportation businesses (including pipeline operators), as well as gathering and processing companies. The remainder is distributed among other sub-sectors such as propane production, marine transportation, and exploration and production (E&P).
Contributors to Recent Poor Performance
Given how closely many MLPs are tied to the energy industry, the recent swoon in energy prices has strongly impacted the performance of these partnerships. From their peak in late 2014, MLP prices have fallen about 30% (as of September 15, 2015). A steady decline in commodity prices since the middle of last year, precipitated by a spike in the U.S. dollar, as well as supply-demand imbalances, have been a drag on the asset class.
Additionally, the income-yielding nature of MLPs makes them susceptible to changes in interest rates. Since the start of the year, yields on U.S. 10-year Treasuries have risen from lows of around 1.7% to current levels of around 2.2%. The rise in rates has not only impacted MLPs but has also affected other income-yielding stocks such as real estate investment trusts and utility stocks. Also, given the strong run-up in MLP prices over the past few years, valuations for the space looked stretched prior to the recent correction, making it vulnerable to a subsequent “re-rating” in prices.
Energy Prices and MLP Fundamentals
The strong sell-off in MLPs over the past few months raises the question of how strongly energy prices affect the underlying fundamentals of these companies. As opposed to upstream companies such as E&Ps, whose revenues are directly tied to the price of energy commodities, we would expect mid-stream companies to be more affected by the volume of the energy products that are transported/processed than their prices. Nevertheless, a valid concern among investors is that structurally lower energy prices, which are a corollary to bloated inventory, can reduce the need to transport more oil and gas. In addition, some gathering and processing companies have certain types of contracts that make them more susceptible to energy prices.
MLP Distribution Growth Rates Remain Positive Despite Oil Price Volatility
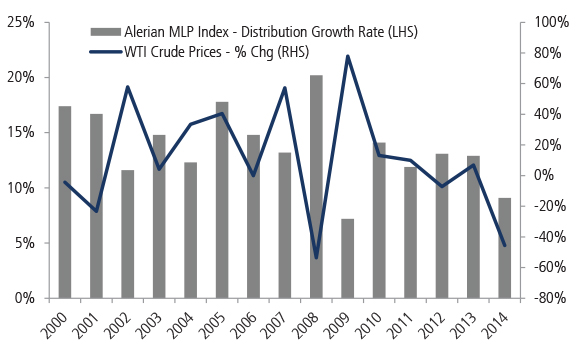
Source: Alerian, Factset. Data from January 2000 – December 2014. For illustrative purposes only. Past performance is no guarantee of future results.
Historically, it appears that the distribution growth rates of these companies do not correlate very highly with the price of energy—though a decline in energy prices can marginally reduce the subsequent year’s distribution growth rates. As such, we believe distribution growth will remain positive in 2015—likely at low to mid-single digit levels. Recent calls with MLP management teams appear to confirm this as earnings seem to be fairly stable.
Is It Time To Jump In?
The recent sell-off in MLPs has pared valuations fairly significantly for the asset class and we believe there could be value in the wreckage. On a number of metrics used to evaluate MLPs, MLPs may look attractive, particular when compared to other income-producing asset classes, such as utility stocks. On an absolute basis, the Alerian MLP Index currently yields around 7.4%, which is considerably higher than the 5.2% it yielded a year ago. When compared to yields for 10-year U.S. Treasuries, the index trades at a spread of around 530 basis points, which is more than one standard deviation above the historical average of 350 basis points since 1998.
MLPs Are Trading at the Widest Spread to Treasuries Since 2009
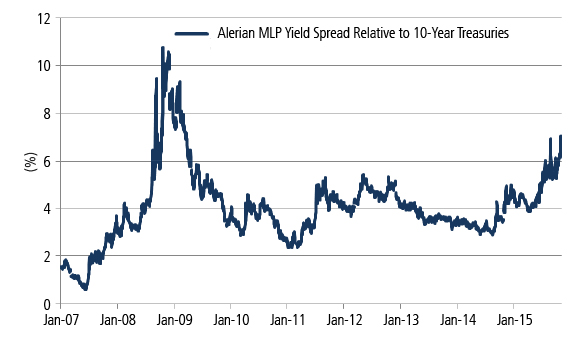
Source: FactSet, as of September 15, 2015. For illustrative purposes only. Past performance is no guarantee of future results.
While we believe that the asset class looks attractive over the medium and long term, we acknowledge that there are short-term risks. As investors strive to anticipate the Fed’s intention on interest rate hikes, we think that volatility in the rates market will continue to affect MLPs, along with other income-generating assets. Moreover, commodities could continue to face turbulence and selling pressure.
Still, we have observed historically that bond volatility is often elevated around the first rate hike of a tightening cycle but recedes thereafter. Moreover, given the large drawdown in commodity prices over the past year, we think they could be closer to equilibrium, providing a more balanced risk/reward going forward. As such, we believe that MLPs could be an attractive opportunity for investors with the patience to wait for a return to normalcy.
This material is provided for informational purposes only and nothing herein constitutes investment, legal, accounting or tax advice, or a recommendation to buy, sell or hold a security. Information is obtained from sources deemed reliable, but there is no representation or warranty as to its accuracy, completeness or reliability. All information is current as of the date of this material and is subject to change without notice. Any views or opinions expressed may not reflect those of the firm as a whole. Neuberger Berman products and services may not be available in all jurisdictions or to all client types.
The views expressed herein are generally those of Neuberger Berman’s Investment Strategy Group (ISG), which analyzes market and economic indicators to develop asset allocation strategies. ISG consists of investment professionals who consult regularly with portfolio managers and investment officers across the firm. This material may include estimates, outlooks, projections and other “forward-looking statements.” Due to a variety of factors, actual events may differ significantly from those presented. Investing entails risks, including possible loss of principal. Investments in hedge funds and private equity are speculative and involve a higher degree of risk than more traditional investments. Investments in hedge funds and private equity are intended for sophisticated investors only. Indexes are unmanaged and are not available for direct investment. Past performance is no guarantee of future results.
This material is being issued on a limited basis through various global subsidiaries and affiliates of Neuberger Berman Group LLC. Please visit www.nb.com/disclosure-global-communications for the specific entities and jurisdictional limitations and restrictions.
The “Neuberger Berman” name and logo are registered service marks of Neuberger Berman Group LLC.
©2015 Neuberger Berman LLC. All rights reserved.