Increasingly, investors are concerned about how their lives and personal investments impact society and the world around them. With that comes fears that investing for sustainability, which often excludes certain sectors such as energy or materials, will interfere with asset allocation criteria and impair a portfolio's risk and return characteristics relative to standard benchmarks. To help determine whether these fears can be substantiated, we analyzed quarterly risk and return data from June 2010 through June 2015 for "portfolios" of S&P 500 companies. We defined "portfolio" as a quintile (i.e., one hundred) of S&P 500 companies, ranked by sustainability as rated by Bloomberg and rebalanced quarterly. The first quintile portfolio consists of the 100 highest rated companies in terms of sustainability, the second quintile portfolio consists of the next 100 highest rated companies, and so on.
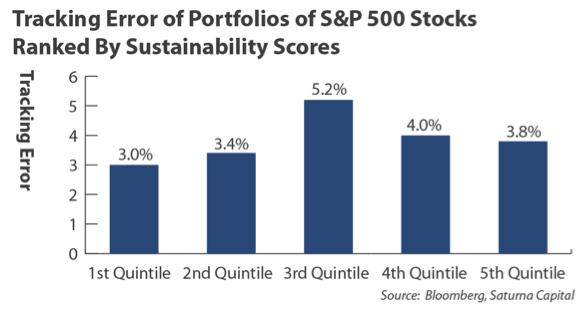
Our analysis focused on the relationship between diversification and tracking error, which measures the differences in return between the portfolio segments and the benchmark as a whole over the designated five year period. Low tracking error, or a smaller variation, in the performance of the sustainable portfolios compared to the index points to sufficient sector diversification over the sample period.
We found:
- The portfolios of stocks with higher sustainability scores performed better than those with low scores.
- Compared with the S&P 500 benchmark, portfolios scoring in the top quintile for sustainability had less tracking error than typical actively managed equity funds.¹
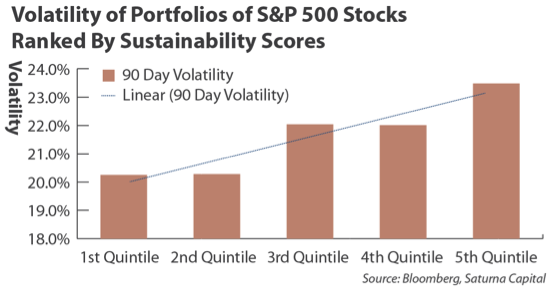
- The higher sustainability, top quintile portfolios exhibited less volatility than the lower quintile portfolios.
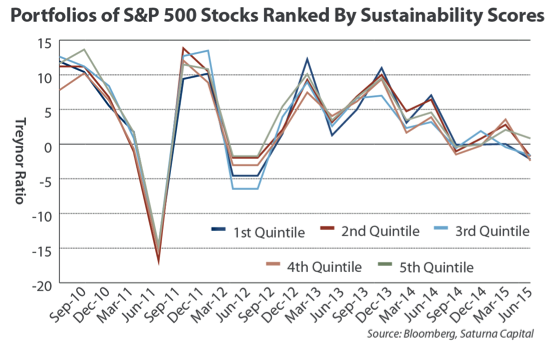
- No significant patterns or biases were identified in the portfolio performance that was adjusted for overall market risk using the Treynor ratios² of the portfolios.
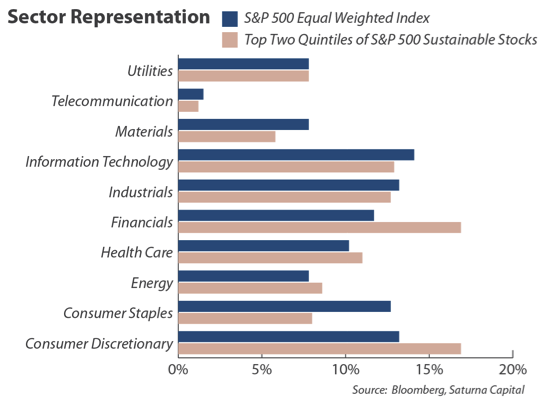
Broad Market Sector Exposure
A sustainable portfolio can in fact achieve broad diversification across sectors as compared to the S&P 500 Index. As of June 30, 2015, portfolios consisting of S&P 500 stocks scoring in the top two quintiles for sustainability had modest Financials and Consumer Discretionary sector underweighting as compared to the S&P 500 as a whole.
Relative to the S&P 500 Index, do portfolios of higher scoring sustainability stocks exhibit significant deviation (tracking error) from the index? The answer is no. Indeed, tracking error over this time period was generally lower for stocks having higher sustainability scores. Financial analysis software design firm Zephyr Associates suggests typical tracking errors for "enhanced index" products range from one to two percent, while "traditional active managers" show tracking errors of four to seven percent.³ By these informal measures, the first and second quintile portfolios demonstrated less tracking error than typical actively managed equity funds, and only slightly more than active index products.
Lower Volatility
It is also worth noting that higher sustainability scores were generally associated with larger companies, and these stocks also had a lower associated volatility.
Negligible Company-Specific Risk
We also wanted to know if material differences exist in risk exposure between sustainable portfolios and the market in general. That is, do higher sustainability portfolios exhibit higher levels of undiversified, company-specific risk? To answer this, we look to the Treynor ratio, which adjusts a particular portfolio's returns for the the risk inherent to the market in general, also known as nonsystematic risk. We found only minute differences between the quintiles, and the modestly positive average value of the Treynor ratio across all quintiles over the period was likely a result of weighting the portfolios equally.
Sustainable Investing is Well-Diversified
In the end, we did not find evidence that a sustainable investment program would have impaired investors' efforts to diversify company-specific risk, minimize volatility, or avoid distortion to asset allocation decisions. Recent data appears to assuage concern that implementing a sustainable investment program will adversely impact investment choice and heighten portfolio risk. Evidence shows that it is possible to build a well-diversified equity portfolio while investing in a socially responsible manner.
Footnotes
¹ According to data collected by Zephyr Associates, Inc.
² Similar to the Sharpe Ratio, Treynor Ratio is a measurement of efficiency utilizing the relationship between annualized risk-adjusted return and risk. Unlike Sharpe Ratio, Treynor Ratio utilizes "market" risk (beta) instead of total risk (standard deviation). Good performance efficiency is measured by a high ratio.
³ Zephyr StatFACTS, http://www.styleadvisor.com/resources/statfacts/tracking-error
Copyright 2015 Saturna Capital Corporation and/or its affiliates. All rights reserved. Vol. 9 · No. 6
Saturna Capital publishes From The Yardarm Market Commentary & Analysis monthly. To subscribe, click here. Saturna Capital does not share subscriber information with third parties.
Important Disclaimers and Disclosures
This report is intended only for the information of the reader and is not to be used for or considered as an offer or the solicitation of an offer to sell or buy any securities or other financial instruments of any kind, including without limitation, any mutual fund or other product offered, sponsored, created, or managed by Saturna Capital Corporation or its subsidiaries or affiliates ("Saturna"). This report is not intended for distribution to, or use by, any person or entity who is a citizen or resident of, or located in, any locality, state, country, or other jurisdiction in which such distribution, publication, availability, or use would be contrary to law or regulation or which would subject Saturna to any registration or licensing requirement within such jurisdiction.
This document should not be considered as providing investment advice or services, or any other service offered by Saturna. Saturna may not have taken any steps to ensure that the securities referred to in this report are suitable for any particular investor. Saturna will not treat recipients as its customers by virtue of their reading or receiving the report.
Nothing in this report constitutes investment, legal, accounting, or tax advice or a representation that any investment or strategy is suitable or appropriate to a particular investor's circumstances or otherwise constitutes a personal recommendation to any investor. Saturna does not offer advice on the tax consequences of any investment.
All material presented in this report, unless specifically indicated otherwise, is under copyright to Saturna. None of the material, nor its content, nor any copy of it, may be altered in any way, transmitted to, copied, or distributed to any other party without the prior express written permission of Saturna. Unless otherwise indicated, all trademarks, service marks, and logos used in this report are trademarks or service marks of Saturna.
The information in this report was obtained from sources Saturna believes to be reliable, and Saturna believes the information and opinions in the material are accurate and complete as of the date of this material. However, information and opinions contained herein will change over time and without notice. Saturna has no obligation to update or amend any information or opinions at any time. Saturna makes no representations as to the accuracy or completeness of this material, nor does it have any responsibility to ensure that any other materials, including any containing materially different information, are brought to the attention of any recipient of this report.
Under no circumstances shall Saturna, its employees, or any affiliate be responsible for any investment decision by any recipient. This material is distributed on condition that it will not form the sole basis or a sufficient basis for any investment decision by any recipient. Any recipient who is not a market professional or institutional investor should seek the advice of an independent financial adviser prior to making any investment based on this report or for any necessary explanation of its contents.
Saturna does not provide tax, legal, or accounting advice. Investors should consult their own tax, legal, and accounting advisers before engaging in any transaction. In compliance with IRS requirements, recipients are notified that any discussion of US federal tax issues contained or referred to herein is not intended or written to be used for the purpose of (A) avoiding penalties that may be imposed under the Internal Revenue Code; nor (B) promoting, marketing, or recommending to another party any transaction or matter discussed herein.
Sharpe Ratio: Developed by Nobel laureate William F. Sharpe, the Sharpe Ratio helps investors evaluate a portfolio's return in terms of risk exposure. A higher Sharpe ratio indicates lower risk exposure relative to the return generated, while a lower ratio indicates relatively high risk exposure. The Sharpe ratio is calculated by subtracting the risk-free interest rate (e.g., that of US Treasury bills) from a portfolio's return, then dividing by the standard deviation of the portfolio's returns.
Beta: A ratio (often encountered as "beta coefficient") that expresses the volatility (risk) of a security or portfolio relative to the volatility of the overall market. A security with a volatility that very closely matches the overall market's volatility will have a beta of 1. more volatile (higher risk) security will have a beta above 1, while a beta below 1 indicates greater stability (lower risk) relative to the market.
Standard Deviation: The measure of how closely a set of data matches the mean (average) value of that data. The higher the standard deviation, the more spread out (or variable) the data points are. The lower the standard deviation, the more closely each data point matches the mean value of the group. Standard deviation can be used to measure the historical variability of a mutual fund's annual return.
Past performance does not imply or guarantee future performance, and no representation or warranty, express or implied, is made regarding future performance. The price for, value of, and income from any of the securities or financial instruments mentioned in this report can fall as well as rise. The value of foreign securities and financial instruments is subject to exchange rate fluctuations that may have a positive or negative effect on the price or income of such securities or financial instruments. Investors in securities such as American Depositary Receipts — the values of which are influenced by currency volatility — effectively assume this risk.