After finishing November in marginally positive year-to-date territory, the S&P 500 sold off by nearly 2% in December, finishing the year down 0.73%, its first down year since 2008.
INVESTORS HEADED INTO DECEMBER PREPARED FOR A LARGELY SYMBOLIC FED RATE HIKE
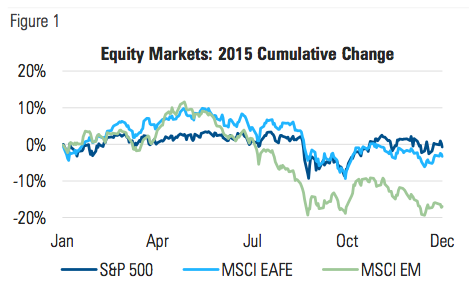
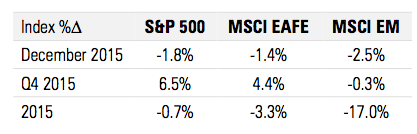
Broad market indexes sold off in December, ultimately finishing the year lower than they started it. After being in positive territory for much of the first half of the year, the second half of 2015 proved to be a more challenging environment:
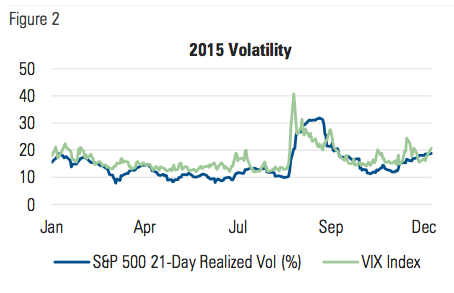
Equity market volatility ticked higher in December, ending 2015 at a level close to where it started the year. Implied volatility as measured by the CBOE SPX Volatility Index (VIX) rose and fell during the middle of the month, even as realized volatility steadily climbed through the end of the year:
MANAGED VOLATILITY PORTFOLIOS
During December, we estimate that a typical 80/20, globally-diversified, growth portfolio with a 15% volatility target saw its net equity exposure decline to 60% as volatility ticked higher. Outside of the elevated volatility in late summer and early fall, the next highest peak in the VIX came in December.
Market volatility in 2015 was higher than in any of the three preceding years. For taking on that extra volatility, investors were rewarded with the lowest calendar year return in the last seven.
More importantly, 2015 was also a year when volatility itself was especially volatile, creating one of the most challenging environments to date for managed volatility strategies. The higher average volatility is the result of periods of low market volatility quickly shifting into exceptionally high volatility. Historically, environments like this have been infrequent and short lived.
MARKET COMMENTARY
The S&P 500 was down 1.8% in December, finishing the year at 2044, down 0.7% from its starting level of 2059. After accounting for dividends and their reinvestment, the index generated a total return of 1.4%, marking its lowest return since 2002, excluding the 2008 financial crisis.
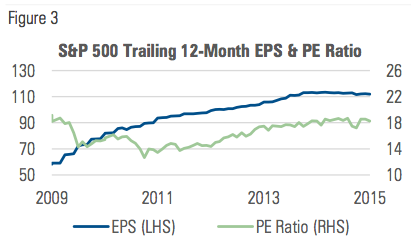
After five consecutive years of steady growth, earnings-per-share (EPS) of the S&P 500 leveled off in 2015, finishing slightly lower than a year earlier:
International developed markets outperformed U.S. equities in local terms, but the rising dollar resulted in a negative return on the year for U.S. investors. Emerging market equities were down 8% in local terms, while the strong dollar added to the losses for investors in the U.S.:
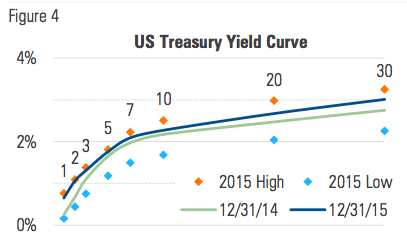
The yield curve shifted higher in December, ending the year higher and flatter than it began. During 2015, the benchmark 10-year yield traded in a range between 1.68% and 2.50%. Daily nominal changes in the yield exhibited their lowest volatility in the last 20 years, due in part simply to the historically low rate itself:
The high yield bond market experienced one of its biggest shifts in recent years. After many months of steady tightening, credit spreads on high yield bonds reversed course in June 2014, widening 150 basis points by year end. In 2015, HY spreads widened another 175 bps to levels not seen since early 2012:
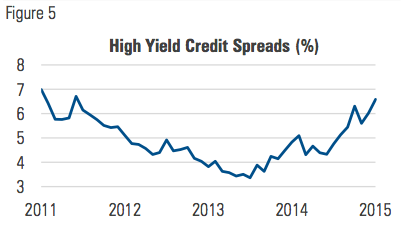
This higher cost of capital for junk-rated companies puts downward pressure on their ability to take on additional debt, and by extension, their potential to grow. If this is a canary in the coal mine signaling trouble ahead for the broader economy, higher market volatility could be in store in the coming months.
NORMALIZATION OF MONETARY POLICY POSES UNCERTAINTY ON MULTIPLE LEVELS
In December the Federal Reserve raised its fed funds target rate for the first time in more than 9 years. The unprecedented circumstances surrounding the increase arguably make it more difficult to understand the implications. There are at least two specific dynamics contributing to this:
- Inflation remains well below the Fed’s 2% target level, as several factors affecting broad price levels exhibit signs of deflationary pressures.
- The Fed has never embarked on a rate hike cycle while the banking system has held so much in excess reserves.
IS RATE HIKE AT ODDS WITH BROADER PRICE TRENDS?
The months leading up to December 2015 paint an interesting picture of a Fed that in some sense appeared to be in denial of the direction of prices, or at the very least struggled to accurately predict them.
After its October 2014 meeting, the Fed’s FOMC statement contained this note regarding inflation:
“Although inflation in the near term will likely be held down by lower energy prices and other factors, the Committee judges that the likelihood of inflation running persistently below 2 percent has diminished somewhat since early this year.”
At that time, annual inflation was at 1.6%, having already begun to trend down from its 2014 high of 2.1%. Crude oil had also fallen to $80 from its 2014 peak of $94, a decline of 17%.
During the seven weeks between its October and December 2014 meetings, inflation readings came in lower and the price of oil fell another 25%. Nevertheless, in its December 2014 FOMC statement, the Fed made a significant shift in its language:
“The Committee expects inflation to rise gradually toward 2 percent [over the medium term] as the labor market improves further and the transitory effects of lower energy prices and other factors [import prices] dissipate.”
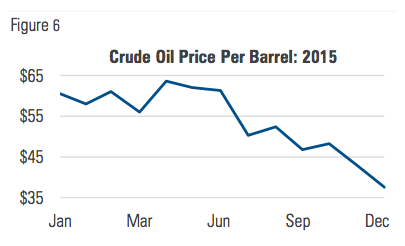
That language (with the additions of “over the medium term” and “import prices”) would remain in effect for all eight of its 2015 FOMC statements, even as oil continued its decline and inflation remained below 1%:
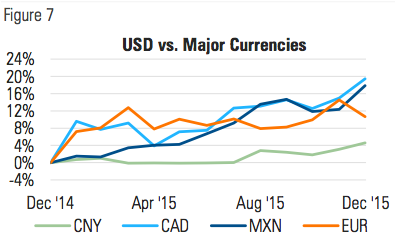
Oil isn’t the only thing that got cheaper. Per the U.S. Census Bureau, 2015 imports from China, Canada, Mexico and Europe accounted for 60% of all U.S. imports. During 2015, the dollar rose against all four of these countries’ currencies, putting downward pressure on the prices of their goods:
Regardless of what the Fed means by “medium term,” 2015 offered little in support of its outlook for rising inflation. After each meeting in 2015, the Fed expected “the transitory effects of declines in energy and import prices [to] dissipate.” With each new statement however, price declines persisted. In spite of the declines, the Fed acted on its “reasonably confident” outlook of higher inflation with its first rate hike in nearly a decade.
It is of course perfectly reasonable to expect that prices of energy and imports will eventually stop falling; the hard part is knowing when and at what level. Sitting at $37 at the end of 2015, is the price of oil more likely to stabilize, rise to $50 or fall to $20? Will the U.S. dollar finally reverse course or continue its ascent?
The Fed seems to be more confident in the former, even as rate hikes arguably increase the likelihood of the latter. While Yellen and company make what they presumably believe to be appropriate policy adjustments, 2016 may be remembered as the year the Fed contributed to the very thing it should have been most focused on preventing.
HOW MUCH MOVEMENT IS POSSIBLE UNDER A MOUNTAIN OF EXCESS RESERVES?
For all the talk of financial repression in recent years, the Fed’s December rate hike appears to have done nothing to alleviate it. Data from the Federal Reserve showed that even after the rate hike on Dec. 16, the average year-end interest rate paid on savings accounts was still 6 bps, same as it’s been since 2013.
One reason for this may simply be that banks currently have little need for additional deposits. Even after years of steady post-crisis loan growth, the ratio of loans to deposits still sits well below its longer-term average:
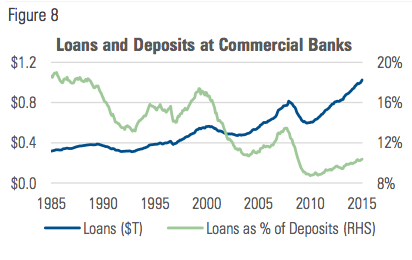
Moreover, the presence of $2.5 trillion of excess reserves in the banking system effectively eliminates the need for banks to acquire additional deposits to meet their reserve requirements. Banks that don’t need deposits have no reason to pay a higher rate for them.
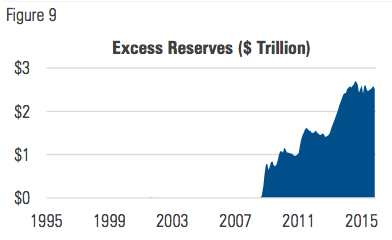
In recognition of its inability to control the fed funds rate the way it traditionally has, the Fed is targeting the interest rate it pays on excess reserves. After the December increase from 25 to 50 basis points, banks are now making twice as much interest on their excess reserves as they were last year. The idea is that they will now be less interested in lending against those excess reserves, which should slow credit growth.
The logic behind this approach isn’t unreasonable, but it is unprecedented. The Fed presumably believes it will work, but, just like trying to predict energy prices and exchange rates, they can’t ultimately know for sure.
With no meaningful inflation to actually respond to, it’s hard to rule out the possibility that the Fed is raising rates for no other reason than to create room to cut in the event of another downturn. It does beg the question, however, if the intent is to hike and remain accommodative, how much will decreasing back to zero actually help? If hiking isn’t doing any harm, then cutting may be of little help.
Whatever the reason, by tackling inflation in an unprecedented manner amidst significant deflationary undercurrents, the Fed contributes to greater uncertainty. There is no road map showing where or how this will end and markets won’t rest until they understand the implications. The road ahead for investors may well be a bumpy one.

Milliman Financial Risk Management LLC is a global leader in financial risk management to the retirement savings industry. Milliman Financial Risk Management (FRM) provides investment advisory, hedging, and consulting services on $190 billion in global assets (as of July 1, 2015).
Established in 1998, the practice includes over 130 professionals operating from three trading platforms around the world (Chicago, London, and Sydney). Milliman FRM is a subsidiary of Milliman, Inc.
For more information:
MILLIMAN.COM/FRM
Milliman, Inc. (Milliman) is one of the world’s largest independent actuarial and consulting firms. Founded in Seattle in 1947, Milliman has 55 offices in key locations worldwide that are home to over 2,600 professionals, including more than 1,300 qualified consultants and actuaries.


