Earnings Recession Experiences Since 1990
Since 1990, the S&P 500 has posted seven periods of at least two consecutive quarters with negative EPS growth (Chart 1). There was a cluster of earnings recessions in the earnings dead zone of the early 1990s, where 11 of 14 quarters posted EPS contractions. The next instance coincided with the Tech bubble as EPS shrank in every quarter of 2001. Not to be outdone, 2008 and 2009 posted a string of eight consecutive quarters, shrinking Last Twelve Months (LTM) EPS by more than 50%.
LTM reported earnings per share for the S&P 500 peaked at year end 2014. While it’s still near that all- time EPS high, each of the three quarters of reported 2015 earnings has suffered a contraction (YOY); meaning, we entered an earnings recession at the end of June. Thanks to evaporating earnings, LTM EPS now stands almost 5% below its all-time high. To see 2015 lumped in with the market meltdown years of 2001, 2008, and 2009 is a bit unsettling.
Chart 1
 S&P 500 In An Earnings Recession
Today’s earnings recession is also unique, given that it is not (yet) being tied to an actual economic recession. While we don’t think we’re on the precipice of economic calamity, the longer that profits and revenues (which have also contracted for the past three quarters) fall short of their peaks, business activity will be adversely affected. A feedback loop of lower revenue and earnings leading to decreasing investment in capital and labor could develop.
Not surprisingly, and as demonstrated by past earnings recessions, performance tends to lag in quarters with declining earnings. During the 32 quarters that experienced LTM EPS shrinkage since 1990, the S&P 500 had an average quarterly total return of +0.69%. On the other hand, the S&P 500 had a +3.43% average quarterly total return during the 70 quarters of EPS expansion.
Is Energy The Culprit?
Chart 2
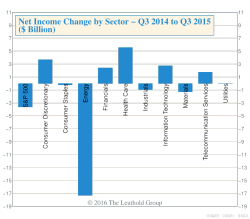
What’s to blame for the current lack of earnings growth? An examination of year-over-year aggregate net income shows that although there were five sectors with negative, or near negative, reported year-over-year growth (Chart 2), Energy clearly receives the lion’s share of the blame for the absolute decline in earnings.
In Q3 of 2015, the S&P 500 reported aggregate net income of $272.8 billion, down only $3.6 billion from Q3 of 2014. By comparison, the five sectors that had lower year-over-year net income were down a combined $19.8 billion — but of that, the 40 Energy sector firms accounted for a whopping 87% ($17.3 billion) of that deficit! Earnings in the Materials sector (which often catches blame along with Energy), were off nearly 16%. Due to Materials’ small weight in the S&P 500, however, the effect was relatively negligible.
“Carving out” the malignant Energy sector in order to show “otherwise healthy” earnings growth in the rest of the S&P 500 has become a common sales spin. This technique may be akin to airbrushing your creepy uncle out of your family holiday photo, but yes, it does result in a rosier picture. If Energy is completely removed from both Q3 2014 and Q3 2015, the other nine sectors show positive year-over-year growth of 5.6%. In fact, we can simplify it further: remove just Exxon Mobil and the S&P 500 returns to net income growth YOY (XOM made $3.8 billion less in Q3 2015 YOY).
But make no mistake, the Energy sector isn’t masking roaring earnings growth in the broad market. Our Up/Down earnings ratio in the “Stock Market Internals” section shows that only 52% of 4,200 firms reported year-over-year growth in earnings during Q3. This is the lowest reading for our Up/Down ratio since 2009.
Margin Growth Necessary
Chart 3
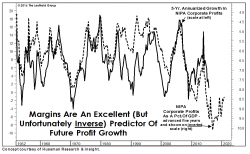
Besides the obvious—which is more favorable year-over-year comparisons eventually coming for the Energy sector (estimates continue to get pushed back as Energy prices keep sliding), how tricky will it be to get back to S&P 500 earnings growth and peak EPS? Without taking a position on commodity prices or the strength of the dollar,we believe the answer lies in margin growth. If history is any guide, inverted corporate profit margins advanced five years predict a rough road for earnings growth in the coming years (Chart 3). What might lead us down that road? We believe low rates, tight spreads, and muted wage growth – the tailwinds that brought us record high margins are beginning to blow in a different direction.
For a number of years, our research has shed light on the underlying causes of the contemporary record high profit margins. From the late 1990s to the all-time margin peak in 2011, the sexier narratives of more automation, increased efficiencies, and offshoring jobs to lower wage locales simply maintained operating margins while lower interest expenses and, to a lesser extent, a lower tax burden juiced bottom lines (Table 1).
Table 1
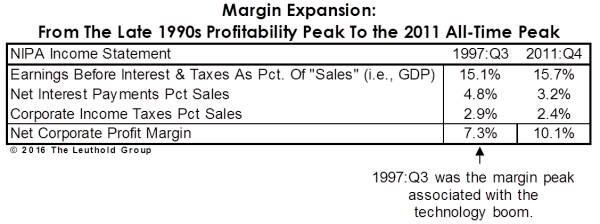
Chart 4
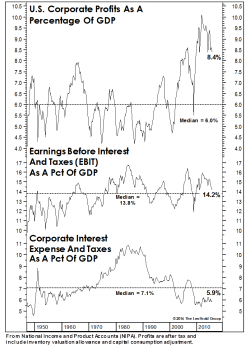
While still at historically high levels, margins have begun to come under pressure the last four years. Although combined interest and tax expenses are little changed from their very low levels, operating margins have shrunk to levels near their historical median (Chart 4).
We have a unique situation with monetary policy in the current earnings recession. During the weak earnings spell in the early 1990s, Fed Funds went from 8.25% to 3%; in 2001, it shriveled from 5% to 1.75%; and in 2008, it shrank from 4.25% to 0.25%. Each period was met with generous easing by the Fed, allowing firms to get a quick and easy boost in their margins via lower interest expenses. On the other hand, periods of tightening by the Fed have usually gone hand-in-hand with robust earnings growth, the assumption being firms could handle higher borrowing costs.
We have argued that we’ve been in a tightening phase since the QE tapering began in January 2014. Given current Fed policy and our still ultra-low rates, this jolt to margins won’t be possible. But wait, rates are still near record lows, couldn’t firms still refinance their credit and take advantage of lower interest expenses? We’d argue that much like mortgage pool burnout, firms that could refinance their debt in the past seven years have already done so.
Current Earnings Backdrop Is Unique
Chart 5

Based on the December 16th meeting, it appears the Fed is intent on moving interest rates higher on an absolute basis. Unfortunately, for many bond holders and leveraged firms, rates have been drifting higher on a relative basis for the last year and a half. These higher borrowing costs, relative or absolute, will no doubt put a crimp in the last decade’s most fashionable way to boost EPS: share buybacks.
Chart 6

We can see the effects of share buybacks on EPS growth for the S&P 500 by subtracting the annualized growth rate in net income from the growth rate on a per share basis (Chart 5). Since 2006, the per share earnings growth rate has outpaced the growth in aggregate earnings by 2% per year. If this cheap, debt-fueled EPS boost goes away, EPS growth could come under further pressure. After ten plus years of this financial engineering, it may come as quite a shock to corporate brass that they need to find “old-fashioned” ways to augment EPS.
Employers slashed workforce expenses as sales and earnings plummeted during the Great Recession. And, for awhile into the economic recovery, they seemed quite satisfied not increasing workers’ earnings (Chart 6). After finding a generational low a few years ago, annual growth in average hourly earnings now appears headed toward normalization.
The brightest data on the 2015 economic landscape may be employment figures. Roughly 2.5 million jobs were created in the past year, and the unemployment rate sits at 5% (Chart 6, lower half). This is yet another unique aspect of our current earnings recession — the three previous earnings recessions were accompanied by rising unemployment rates, most notably 2008.
While one could argue the lack of participation in today’s employment market, and the severity of our current situation, the bargaining power of employees appears to be much better compared to the past earnings recessions of 2001 and 2008. Unless the great American job machine slows down, increasing employment costs will keep a lid on margin growth.
The 2015 earnings recession is a different breed of cat compared to past EPS slowdowns. Today’s earnings headlines are dominated by the Energy sector as the broader market sits mired in an earnings malaise. Past earnings recessions have been coupled with actual economic recessions. While below trend, 2015’s GDP figures have stayed in positive territory and show no imminent signs of dipping negative.
Levers usually available to boost EPS aren’t present in the current environment. In the past, earnings recessions have been met with an accommodative monetary policy, while we’re in the midst of a tightening phase. This should negate the relative EPS boost from lower borrowing costs and cheaply financed stock repurchases. During past earnings recessions, unemployment rates have spiked and wage pressures have eased, but in the current setting, job growth remains robust and average hourly earnings are improving (no matter what Donald Trump says), three quarters into the earnings recession. We are concerned that these “unusual” elements will result in a longer period of stagnant earnings before growth resumes.
Margins, while still historically high, are coming under more pressure from the top line as well. A lack of pricing power in the current disinflationary period is leading to lower revenue growth. EPS will continue to drag if the top line issues aren’t resolved.
As shown in Chart 7, prices for the S&P 500 and its earnings go hand-in-hand. Further advances in the market seem unlikely if EPS growth doesn’t resume.
Chart 7

© 2016 The Leuthold Group


