Markets tumbled out of the gate in early 2016 sending investors fleeing to quality. Rates around the globe plummeted in response, pushing some countries’ yield curves further into negative territory.
NEW YEAR USHERS IN NEW PERSPECTIVE AS MARKETS MAKE RECORD-SETTING JANUARY CORRECTION
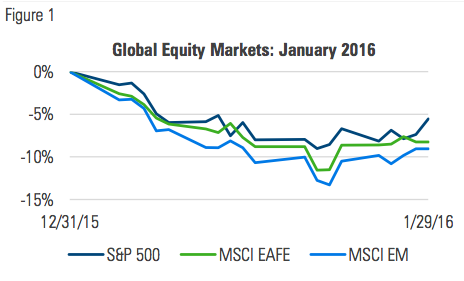
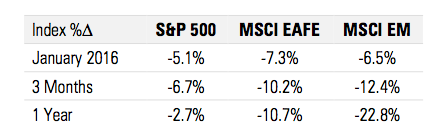
Investors woke up in the new year and decided capital markets were significantly overvalued. Economic weakness and market turmoil in China along with the continued decline in the price of oil rattled global markets in January:
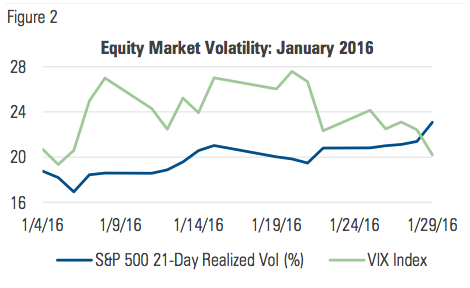
Implied volatility fluctuated during the month, even as realized volatility churned steadily higher:
MANAGED RISK PORTFOLIOS
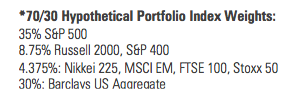
During January, we estimate that a typical 70/30, globally-diversified multi-asset portfolio* with a 10% volatility target saw its net equity allocation immediately begin to adjust downward as volatility ticked higher.
Its net equity exposure dropped from approximately 60% at the beginning of the month to 30% by Jan. 20, where it remained through the end of the month. Over the course of the month, the hedged portfolio exhibited about two-thirds of both the volatility and max drawdown of its unhedged counterpart.
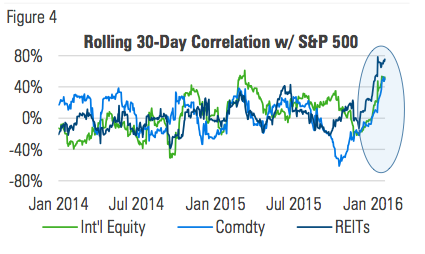
A foundational premise underlying the construction of managed risk portfolios is that diversification has merit, but alone it cannot be relied on to consistently maintain a desired level of volatility or to always protect against drawdowns. Consider the charts in figures 3 and 4.
The idea behind the benefit of diversification is that by combining different uncorrelated asset classes, some will zig when others zag, thereby smoothing the portfolio’s return path.
So long as these assets remain uncorrelated, an investor may be able to experience a consistent level of volatility. The problem is that short-term levels usually differ from long-term averages.
Figure 3 shows volatility ranges for the S&P 500 Index along with other asset classes traditionally considered to be diversifiers:
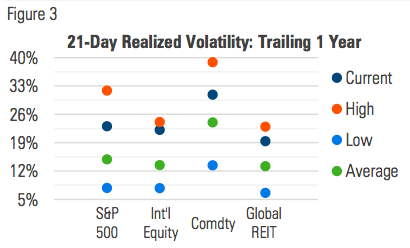
If correlations increase (like they did in January) and volatility also rises, diversification alone will be unable to prevent a portfolio from exhibiting higher volatility.
Moreover, rising correlations exacerbate the damage to a portfolio in the midst of sustained drawdowns, as happened during the 2008 liquidity crisis. In 2016 during the first two weeks of January, correlations increased as nearly everything sold off, diminishing the benefits of diversification:
Managed risk portfolios are designed to capture the benefits of diversification when correlations are low, but also to protect against drawdowns and volatility when correlations increase.
MARKET COMMENTARY
The S&P 500 Index has never seen a worse start to a new year than it did in 2016. The index finished the month 5.1% lower, but not before being down by as much as 9%. Developed and emerging market equities followed suit.
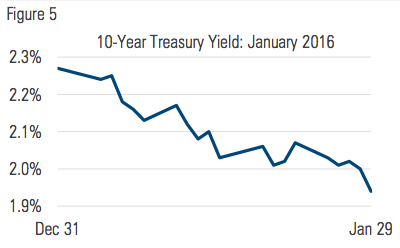
After finishing 2015 at the higher end of its range for the year, the yield on the 10-year Treasury began a month-long descent to 1.94%, a level not seen since April 2015:
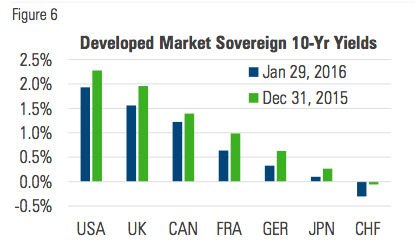
U.S. rates weren’t alone in shifting down; around the globe, developed market interest rates moved sharply lower as investors sought a safe haven from risky assets:
At the end of January, just one month after the Federal Reserve raised the interest rate it pays on excess reserves, the Bank of Japan did just the opposite, cutting its IOER to -0.1%.
While the change is significant for the insight it offers into the minds of central bankers, negative rates were already common place in much of the developed world. In Japan, the yield on the 1-year government bond spent most of 2015 oscillating around 0% and all of Q4 in negative territory.
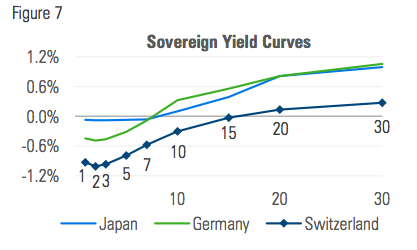
In Germany and Switzerland, 1-year government bond yields were negative for all of 2015; the Swiss curve isn’t positive until 20 years out, and even there it’s only 13 basis points:
WHAT IS THE MEANING OF NEGATIVE INTEREST RATES?
Assuming that no investor willingly hands over their money fully expecting to get only a portion of it back, how then are negative interest rates to be understood? In what context or under what circumstances do they make sense?
Whether rates are positive or negative, a bond’s credit risk is always accompanied by the potential for change in the purchasing power of the currency in which the bond is denominated.
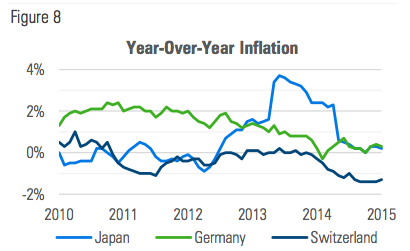
If low rates signal low inflation, then there is perhaps no stronger signal of deflationary undercurrents than negative interest rates.
For local investors the future value of their currency is a function of domestic price levels. If the general price level is expected to be higher in the future, interest rates will reflect an inflation premium to account for those higher prices.
Conversely, if prices are expected to be lower, interest rates will account for that too. If rates are low to begin with, it stands to reason that an expectation of lower prices can create negative interest rates. This is what seems to be happening in Japan and Europe, where no amount of monetary stimulus is able to generate persistent inflation:
As the saying goes, “you can lead a horse to water, but you can’t make it drink.” The longer that growth and inflation remain resistant to easy money, the more it seems that the challenges facing the global economy go beyond anything the central banks can offer. In fact, the uncertainty created by central bank activism could arguably be viewed as inhibiting the very outcomes they’re looking to produce.
The Fed’s December hike may be an implicit acknowledgement of this, while the January selloff may be a recognition of the Fed’s resolve to stop propping up markets. That’s painful in the near term, but good for the long run strength of the economy.
© Milliman Financial Risk Management


