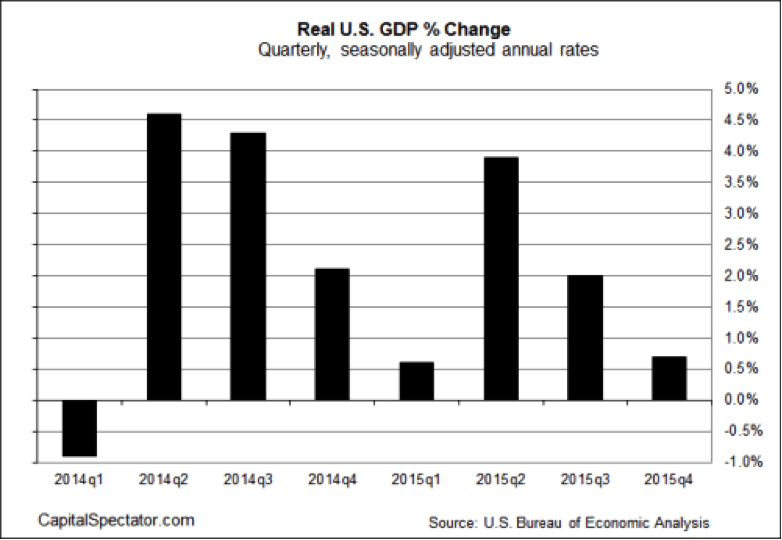
The advance release of the U.S. 4th quarter Gross Domestic Product (GDP) numbers was disappointing. After running at a 4%+ pace in the middle of 2014 and between 2% and 4% earlier last year, the fourth quarter 2015 GDP rose only 0.7%. Household consumption growth fell and non-residential business fixed investment declined after rising earlier in the year. Government spending has recovered but that was the only bright spot in the report.
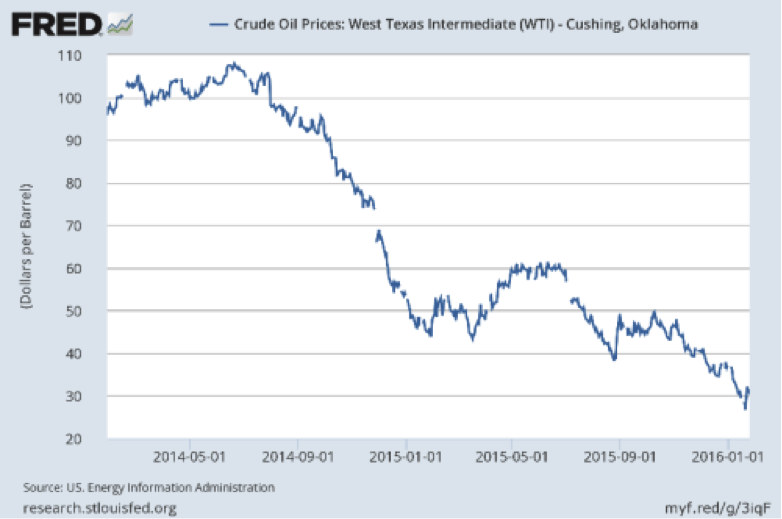
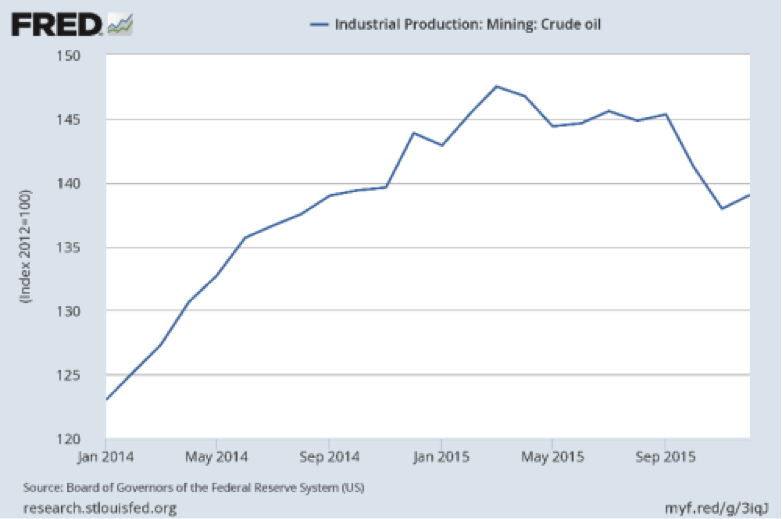
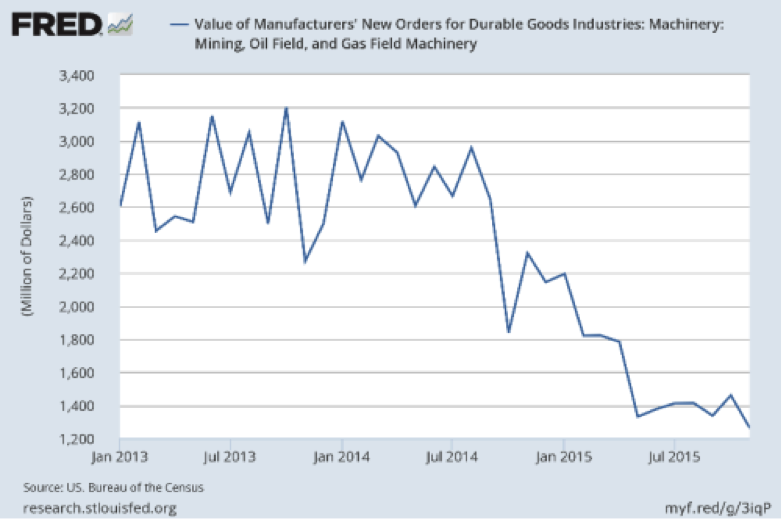
We are now in the seventh quarter of the oil price decline. The drops in oil production and energy equipment expenditures have been evident.
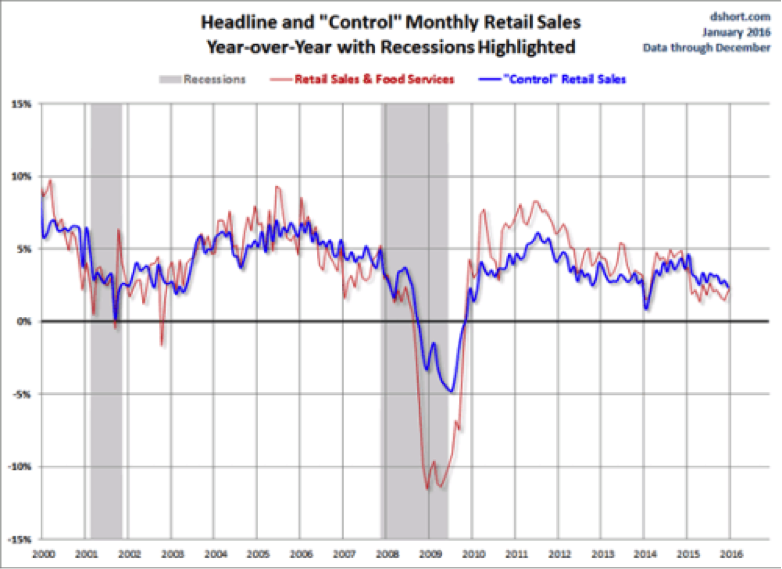
But the boost to the U.S. consumer from lower oil prices has not shown up in retail sales numbers. The chart below presents two measures of retail sales: total or headline sales and “control” sales that removes “necessary” sales such as food, energy, motor vehicles & parts, building materials and food services & drinking places sales. Both data series indicate that year-over-year growth in retail sales were lower in 2015 than 2014. In other words, lower oil prices should have accelerated sales growth but growth actually decelerated.
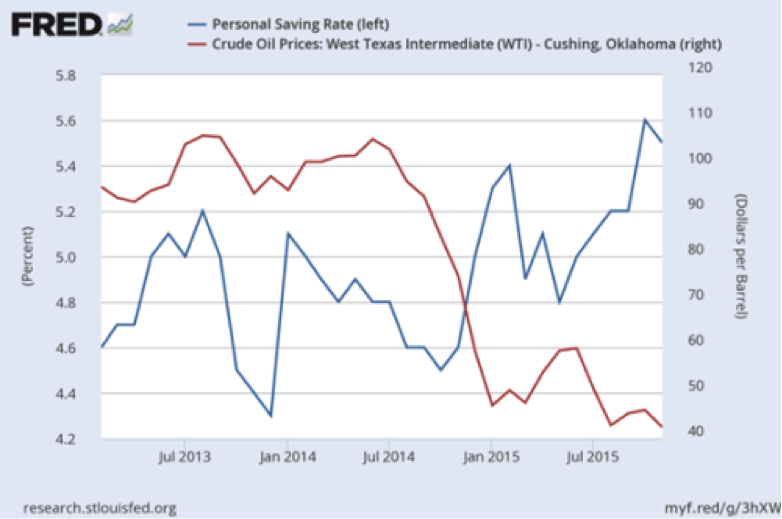
Given that we have all enjoyed lower gasoline pump prices, what are we doing with the found cash? There are three places where the money has gone. One, we are saving more and paying down debt. Many of us have learned our lesson from the 2000 to 2002 and 2008 to 2009 recessions. When we get the chance, we reduce our indebtedness and build our savings and investment accounts. Given the need for the large Baby Boomer cohort to continue this behavior in order to retire and the frugalness of the Millennials, we should see these result into the future.
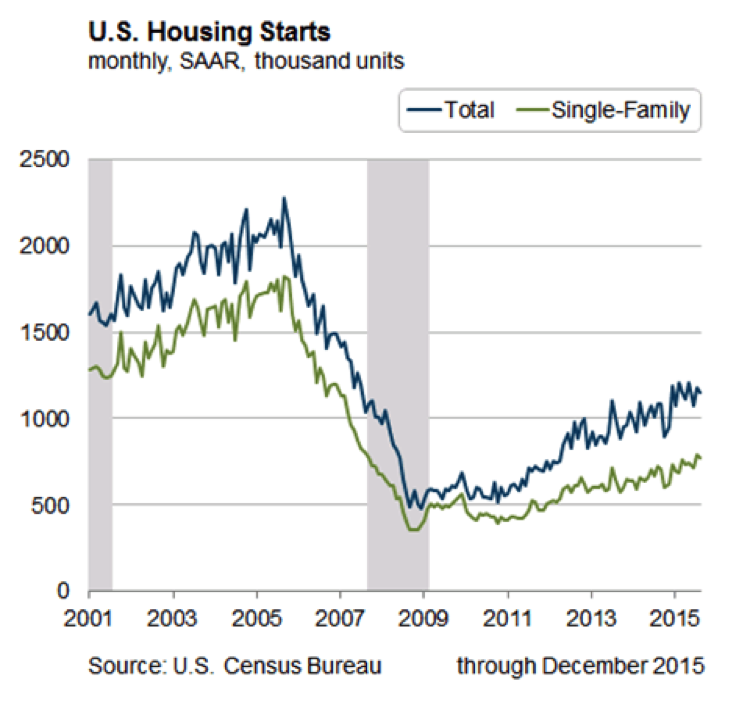
Two, we are allocating more dollars to housing. Given the lack of household formations after the Great Recession, there has been pent-up demand for residential investment as families recover from financial decline and Millennials become independent. Although real estate purchases themselves do not show up in retail sales, all of the additional expenses incurred when a residence is bought are included. Still, at 18% of U.S. GDP, housing expenditures are not large enough to carry the economy on its own.
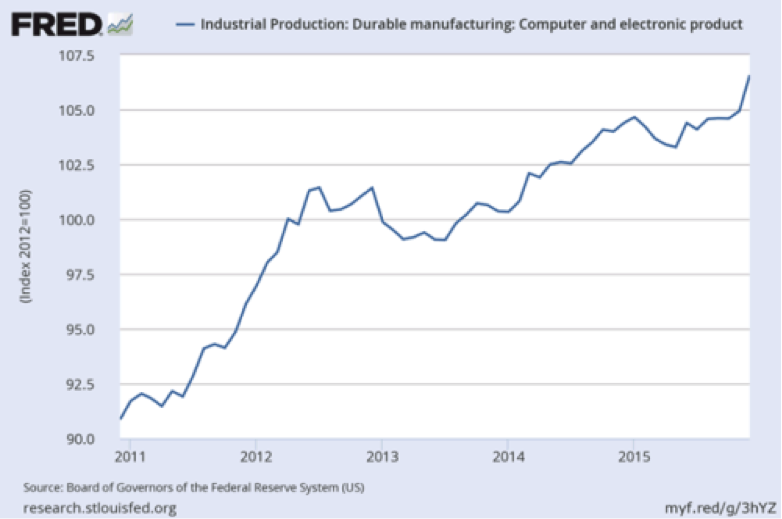
Finally, technology spending has been overwhelming. Clearly, households and businesses are in the process of catching up from the lack of electronic sales during and after the Great Recession. The power and quality of experience available in today’s computers, cell phones, televisions and other entertainment devices are significantly higher than five to ten years ago. Still, at a small percentage of U.S. GDP, technology expenditures will not drive overall economic growth.
Investment Implications: It is obvious that the U.S. economy will remain slow for a number of quarters to come. Unfortunately, the Federal Reserve maintains its commitment to hiking the Federal Funds interest rate by 100 basis points (1%). We believe that the Fed’s recent interest rate increase and their continuing strident statements implying that the economy is growing at an acceptable rate and inflation is increasing led to the market rout that began in December. Although the Standard & Poor’s has declined 9% from the May highs and 7% from the post-Fed December highs at January’s month-end, we believe that this could be a bear market and another 10% to 15% decline is possible. We also believe that the Fed will not be able to increase interest rates at all this year given economic conditions. If voting participants on the Fed Open Market Committee disavow the current increasing rate stance, the market should see that as passing a reality check and be able to stabilize. Given our concern that the Fed has backed itself in a corner and will be slow to get out, we are negative on U.S. equities.
We are bullish on the U.S. Treasury market. Financial advisors should consider adding tactical strategies that can be heavily weighted to Treasuries. Treasuries are the most attractive asset class in times of stock market peril. In November, we called for the thirty year Treasury, then at 2.95%, to test the 2.25% early 2015 lows. At the current 2.75% level, with a 20 year duration, we could see a 10% (20*0.50) price increase plus the yield earned in 30 year Treasuries this year.
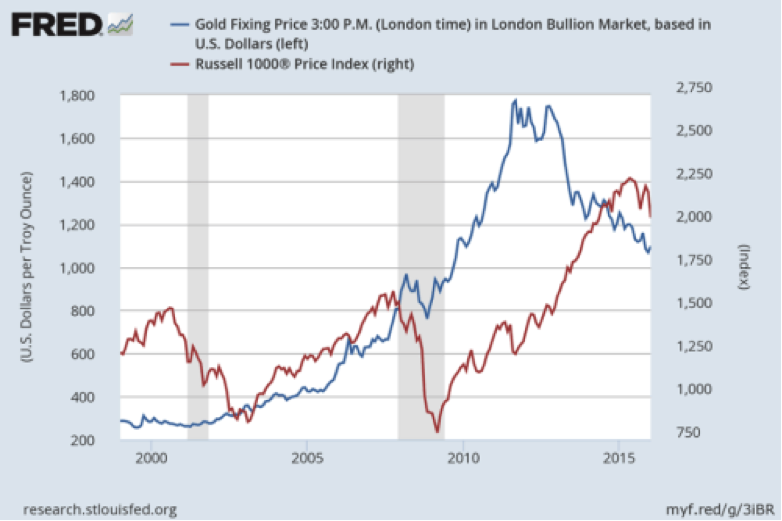
Financial advisors should also consider adding precious metals bullion and stock funds to client portfolios. Although past performance is not indicative of future returns, these funds were up 5% to 8% in January. As the chart below indicates, precious metals tend to participate in the initial leg down in bearish stock markets. After March 2001 and October 2008, gold was a great diversifier in the second part of the declines. We believe that gold put in a cyclical low in December and will earn positive results in 2016.
Additional Source: Gann Global Financial