FEBRUARY LENT VALIDATION TO JANUARY’S SELLOFF AS MARKETS SETTLED AT LOWER VALUATIONS
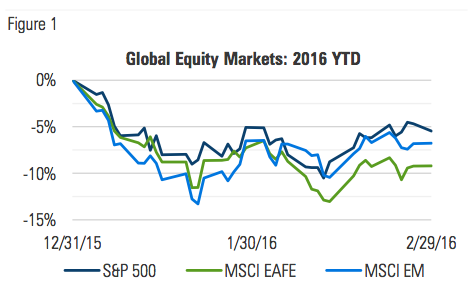
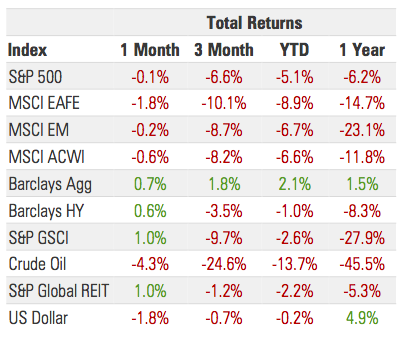
After finishing January on a note of recovery, markets began February with another sharp downturn, falling more than 5% during the first half of the month. Their course reversal during the last two weeks helped minimize losses, but left them firmly in the red year-to-date:
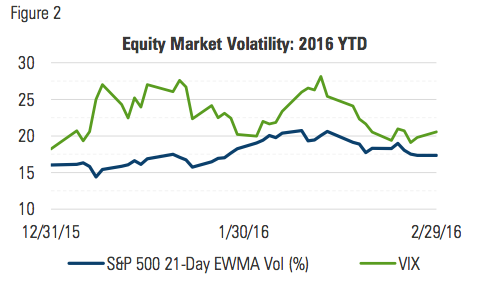
Volatility trended higher into the middle of the month before reverting back to end- of-January levels:
MANAGED RISK PORTFOLIOS
During February, we estimate that a typical 70/30, globally- diversified multi-asset portfolio* with a 10% volatility target saw its net equity allocation fluctuate between 30% and 40%.
After finishing 2015 at approximately 60%, it was reduced to 40% during the first week of 2016 and has remained below that level year-to-date, as volatility has remained elevated.
The reduced equity level resulted in the hedged portfolio exhibiting less than half the volatility of its unhedged counterpart and participating in less than half the drawdown. Heading into March with a net equity allocation of 39%, the portfolio remains well hedged in the event of continued volatility, but ready to adjust to changing conditions.
The sequence of market returns during the first two months of the year offer a nice case study to consider the effects of withdrawals from an investment portfolio. Suppose a hypothetical investor begins 2016 with $1 million dollars invested in a globally diversified equity portfolio, represented by the MSCI All Country World Index and makes monthly withdrawals.
Figure 3 highlights the potentially devastating effects of withdrawals coinciding with market drawdowns. If he had taken $5,000 withdrawals on the market’s lowest days in both January and February, the value of his portfolio would be 2.1% ($21,000) lower than if he had taken no withdrawals at all, even though he only withdrew 1% of the initial $1 million:
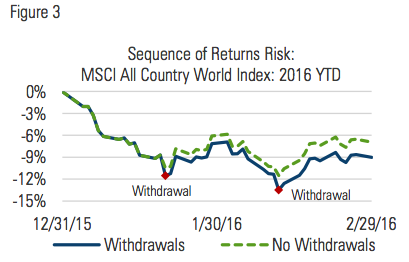
This illustrates the importance of mitigating drawdowns, particularly on portfolios from which withdrawals are being made. Managed risk portfolios are designed to protect against sustained market declines and reduce sequence-of-returns risk.
MARKET COMMENTARY
After a mild recovery from one of the worst starts on record to a new year, equity markets again began to fall in February, in some cases breaching their January lows before reversing course and finishing the month moderately lower.
Fixed income markets were positive on the month as rates shifted down again, leaving the yield curve significantly lower than it was this time a year ago:
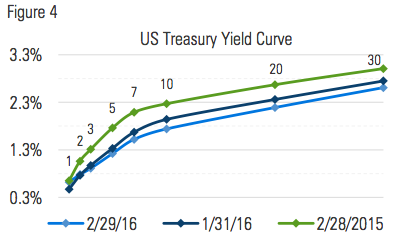
The yield on the benchmark 10-year Treasury bond continued the steady descent it made throughout January, trading down to 1.63%, a level not seen since 2012.
Part of the downward pressure came from outside the US where persistent skepticism and no sign of inflation pushed sovereign yields to record lows. The yield on Japan’s 10-yr sovereign bond dropped into negative territory while Switzerland’s fell even further into it, finishing the month at -0.48%.
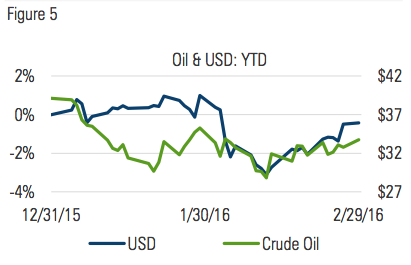
February 11 saw crude oil touch its all-time low price in nominal terms at $28.74, before finishing the month at $33.75. The dollar followed oil down, selling off 3% and then reversing course:
HAVE CENTRAL BANKS EXHAUSTED THE EFFICACY OF MONETARY POLICY?
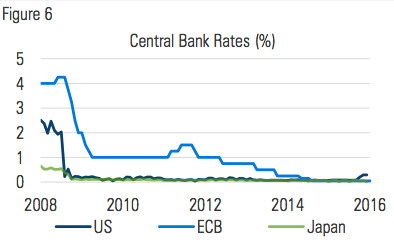
In response to the global financial crisis, central banks of the US, Europe and Japan have implemented and maintained unprecedented amounts of monetary accommodation and stimulus. The first and primary way was to cut and maintain their short-term lending rates at or near zero in an effort to stimulate economic activity through lending and investment:
As a complement to their interest rate policy the same central banks have also spent the last seven years growing their balance sheets. By purchasing bonds and mortgage related securities, central banks have aimed to shorten the duration of commercial bank holdings and put downward pressure on longer term rates. Today they hold nearly $11 trillion in combined assets:
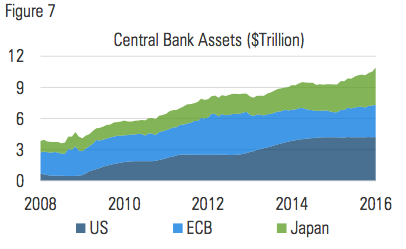
In spite of holding rates at zero (now below zero in the case of Japan) and piling up assets in an amount greater than the GDPs of most national economies, growth has remained elusive and inflation has remained low.
With this record-level of monetary stimulus failing to produce the desired levels of growth and inflation, it stands to reason that the problem may fall outside the domain of monetary policy. Might an answer reside on the fiscal side of the policy coin?
In the heat of election season, candidates are now regularly touting their own approach to fiscal policy. And while their ideas of sound fiscal policy may cover a wide spectrum, there is a fundamental economic truth that underlies all of them. Nearly 3000 years ago, the famously wise King Solomon is believed to have put it like this: “But this is gain for a land in every way: a king committed to cultivated fields.”
If he were on the campaign trail today, he’d probably update it to say something more like this: “But this is good for a country in every way: a government committed to cultivating a thriving environment for profitable work.”
Underlying this are at least two important assumptions. First, work is good. Second, government is ultimately financed by taxing the profits earned from working.
Over the last 10 years, tax revenues have fallen far short of government spending. In each of these years the government has run deficits ranging from $160 billion to as large as $1.6 trillion. Not surprisingly, the national debt has more than doubled, rising from $8 trillion to more than $19 trillion:
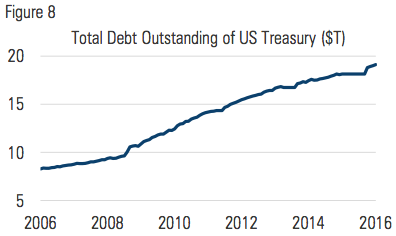
A trillion is not an easy number to comprehend. Consider that the accumulation of $1 million a day from the time of the birth of Christ through the end of 2015 would fall more than $260 billion short of $1 trillion. The US owes more than 19 times that amount and that doesn’t even account for unfunded liabilities.
Nevertheless, all else equal, if debt must be incurred, the post- 2007 low-rate environment has been a relatively favorable one for doing so. Still, in the absence of an increase in tax revenues or a reduction in government spending, that debt will eventually have to be rolled over.
If rates are higher when the debt comes due, more tax revenue will eventually have to be allocated to servicing the debt. In that light, reducing the debt becomes all the more important. For fiscal policy, this is where the rubber meets the road.
A policy that cultivates an environment for profitable work might not only contribute to the growth that has been so elusive in recent years, but may also offer the potential to reduce the debt without necessarily reducing government spending:
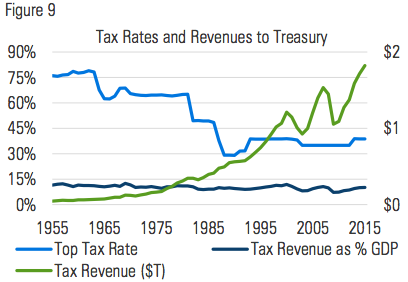
Figure 9 shows that since 1955, income tax revenues as a percent of GDP have been remarkably consistent, between 9% and 13%, in spite of the widely varying levels on the top income tax rate.1 Even as the top tax rate has fallen, revenues have risen as a function of a growing economy. All else equal, more people working equates with a larger tax base, and higher productivity equates with more taxable income.
The slow pace at which fiscal policy gets changed, however, leaves the door open for ongoing central bank activism. The magnitude of stimulus to date though, appears to have diluted its potency going forward. By communicating an intention to normalize policy, central banks could begin to reduce the uncertainty their activism creates. It could also provide a catalyst for governments to make fiscal policy changes. The Fed appears to have embarked on that path and other central banks may do well to follow suit.
In the meantime, we expect uncertainty to persist at elevated levels and market volatility with it. Accordingly, actively monitoring and managing risk remains a key component to portfolio and wealth management.
1 Source: Tax Policy Center, as of February 29, 2016. Top tax rate is the revenue-weighted average of the top corporate and individual rates.
For Financial Professional Use Only. Not to be Distributed to Members of the Public.
All data as of February 29, 2016. Unless otherwise noted, all data is sourced from Bloomberg.
Email [email protected] to receive Milliman FRM’s market commentary.
*70/30 Hypothetical Portfolio Index Weights: 35% S&P 500 8.75% Russell 2000, S&P 400 4.375%: Nikkei 225, MSCI EM, FTSE 100, Stoxx 50 30%: Barclays US Aggregate

Milliman Financial Risk Management LLC is a global leader in financial risk management to the retirement savings industry. Milliman Financial Risk Management (FRM) provides investment advisory, hedging, and consulting services on $190 billion in global assets (as of July 1, 2015).
Established in 1998, the practice includes over 130 professionals operating from three trading platforms around the world (Chicago, London, and Sydney). Milliman FRM is a subsidiary of Milliman, Inc.
Milliman, Inc. (Milliman) is one of the world’s largest independent actuarial and consulting firms. Founded in Seattle in 1947, Milliman has 55 offices in key locations worldwide that are home to over 2,600 professionals, including more than 1,300 qualified consultants and actuaries.
for more information: MILLIMAN.COM/FRM
FOR INVESTMENT PROFESSIONAL USE ONLY
Recipients must make their own independent decisions regarding any strategies or securities or financial instruments mentioned herein.
The products or services described or referenced herein may not be suitable or appropriate for the recipient. Many of the products and services described or referenced herein involve significant risks, and the recipient should not make any decision or enter into any transaction unless the recipient has fully understood all such risks and has independently determined that such decisions or transactions are appropriate for the recipient.
Any discussion of risks contained herein with respect to any product or service should not be considered a disclosure of all risks or a complete discussion of the risks involved.
The recipient should not construe any of the material contained herein as investment, hedging, trading, legal, regulatory, tax, accounting or other advice. The recipient should not act on any information in this document without consulting its investment, hedging, trading, legal, regulatory, tax, accounting and other advisors. The materials in this document represent the opinion of the authors and are not representative of the views of Milliman, Inc. Milliman does not certify the information, nor does it guarantee the accuracy and completeness of such information. Use of such information is voluntary and should not be relied upon unless an independent review of its accuracy and completeness has been performed. Materials may not be reproduced without the express consent of Milliman.
MIL_COM_1 2/16_2/17


