Global equity markets sprang into action in March, notching a monthly return ranking among the top 10 in the last 10 years. The price of oil finished the month higher as the US dollar continued its descent.
EQUITY MARKETS CHURNED HIGHER AS INVESTOR CONFIDENCE INCREASED AND RECESSION FEARS EASED
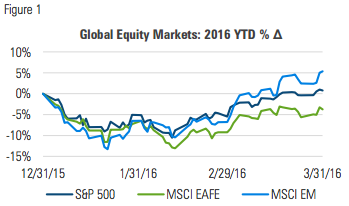
March saw a continuation of February’s second half reversal as U.S., developed and emerging markets all moved firmly higher and (with the exception of EAFE) into positive year-to-date territory:
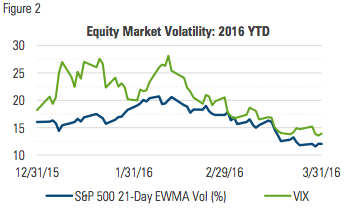
Volatility in March extended the downward trend it began in February, falling back to levels experienced during much of the first half of 2015:
MANAGED RISK PORTFOLIOS
During March, we estimate that a typical 70/30, globally-diversified multi-asset portfolio* with a 10% volatility target increased its net equity allocation from approximately 40% to nearly 65%, the same level that it began 2016.
The increased equity exposure came as a result of the continuing decline in volatility, giving the portfolio greater exposure to the market’s move upward. With an average equity allocation of 40% year-to-date, the portfolio has participated in about two-thirds of the max drawdown and less than two thirds of the volatility of its unhedged counterpart.
One of the differentiating features of managed risk portfolios is that they allow for a dynamic rather than static allocation to bonds. By seeking to maintain a larger allocation to equities, managed risk portfolios may be able to provide a better long-term hedge against inflation. Here’s why.
Bonds (unlike stocks) offer no ongoing means of adjusting to changes in inflation. A bond investor must use an estimate for expected inflation at the time a bond is purchased. Once the cost basis and yield are set, the bond’s fixed coupon means that compensation for inflation is locked in.
Stocks, however, are better equipped to keep up with inflation because earnings are a function of price levels in the broader economy. Consider this simple illustration to see how higher prices flow through to stock returns:
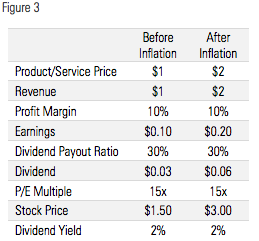
This illustrates the importance of mitigating drawdowns, particularly on portfolios from which withdrawals are being made. Managed risk portfolios are designed to protect against sustained market declines and reduce sequence-of-returns risk.
MARKET COMMENTARY
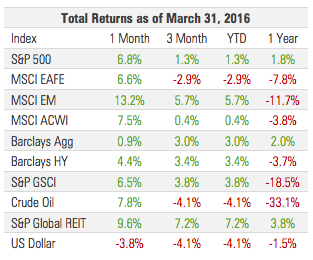
The S&P 500’s 6.8% total return in March is the third highest calendar-month return over the last five years. Excluding the 8.4% in October 2015, the next highest monthly return dates all the way back to October 2011. Since its low in mid-February, the S&P 500 has generated a total return of 13.0%.
Investment grade fixed income markets were positive for their third consecutive month, as credit spreads tightened substantially while the yield curve traded in a narrow range:
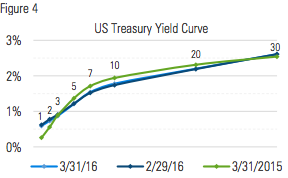
The yield on the 10-year Treasury bond edged upward, almost breaking through 2% at mid-month before reversing course and finishing the month just four basis point higher.
Rates outside the U.S edged slightly higher. In Germany, Switzerland and Japan, much of their yield curves remains in negative territory, with positive yields not available inside of maturities of less than 10 years.
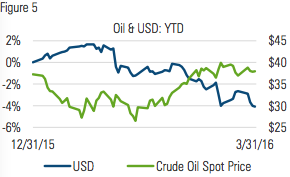
The spot price of crude oil continued to climb off its all-time low in February, nearly breaking through $40/barrel before settling back below $38 by month end. The US dollar, as measured by the Bloomberg Dollar Spot Index was down 3.8%, its largest monthly decline since April 2011:
The latest inflation numbers showed that the seasonally adjusted CPI was down 0.2% in February while Fed’s preferred measure (PCE) was up 0.1%. Over the last year, CPI is up 1% while core CPI (ex food and energy) is up 2.3%.
WHY HAS INFLATION BEEN SO LOW IN THE FACE OF UNPRECEDENTED AMOUNTS OF MONETARY STIMULUS?
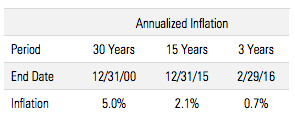
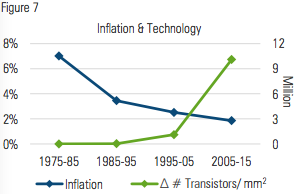
Over the last 40 years, the rate of U.S. inflation has trended steadily lower. After peaking at nearly 9% in the early 1980s, the rolling 10-year annualized rate of inflation has gradually fallen to less than 2%:
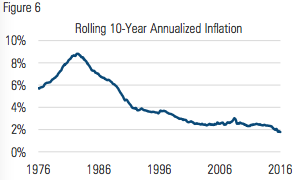
In and of itself, such a steady decline in inflation over such a long time period is noteworthy. Even more remarkable, however, is the continuation of the trend in recent years in the midst of unprecedented amounts of monetary stimulus:
In attempting to explain this trend, it may not be intuitive to consider the role of technology and the rapid pace of its advancement. The ubiquity of smart phones and cloud computing today make them easy to take for granted. It wasn’t that long ago, however, that these things didn’t exist even conceptually.
There has arguably been no greater example or driver of technological advancement than the evolution of microprocessors – the small chips that run the electronic devices that are so heavily relied on in the 21st century.
Their rapid pace of development over the last 40 years is nothing short of astounding and has been largely defined by the growing number of transistors they hold. The first microprocessors manufactured in the early 1970s contained fewer than 5,000 transistors. Today they hold billions.
In 1965, Gordon Moore (cofounder of Intel Corp.) observed that the number of transistors in a dense integrated circuit doubled every two years. This became known as Moore’s law and has served as a roadmap of sorts for chip manufacturers and the rate at which chip performance has increased.
Over the last 40 years, the quality of transistors has increased even as their size and cost has decreased exponentially.
COLLEGE FRESHMEN: 1976 VS. 2016
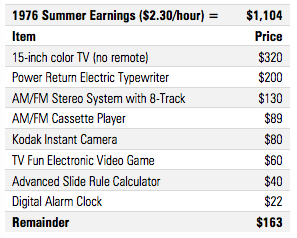
To illustrate the point, consider a hypothetical newly minted high school graduate in the summer of 1976 preparing to head off to college. Suppose he works a minimum wage summer job for 40 hours/week for 12 weeks. Using prices from the 1976 JC Penny catalog, here’s a list of what he could have purchased for his freshman year dorm room:
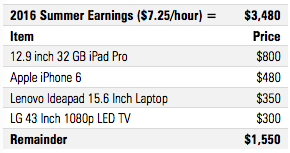
Compare that hypothetical baby boomer to a hypothetical millennial working a minimum-wage summer job before heading off to college in 2016. Using prices from Amazon.com, here’s a list of what she could purchase to take to school:
In comparing the shopping lists of these two students, a couple points are worth noting:
- If she really wanted to, with a couple inexpensive accessories the millennial could use the iPhone to do all the functions (and more) performed by the items on the baby boomer’s list, and have a lot more money left over.
- If the national minimum wage had kept pace with the 3.7% annualized rate of inflation since 1976, it would be $9.83 in 2016. That would translate into an additional $1,237 of pre-tax summer earnings.
On an inflation adjusted basis, the millennial’s wages today are less than the baby boomer’s in 1976, but they buy her vastly more computing power. Today, a college freshman anywhere in the world with a smartphone is walking around with more computing power than was available to all of NASA in the 1970s.
Importantly, this trend has not been restricted to individual consumers; small businesses and large corporations alike have benefited from the increases in available computing power and the reduction in its cost. In fact, many recently created businesses would not exist in the absence of this technological phenomenon. Notably, many of them are not manufacturers of electronic products, but are nevertheless generating similar deflationary pressures.
For instance, services like Google Shopping and Amazon generate considerable deflationary pressure by enabling consumers to quickly compare prices across multiple brands and retailers. In 1981, a gigabyte of hard-drive storage cost $300,000. Today, Google users receive 15 GB free while users of Amazon Prime receive an unlimited amount of cloud storage at no extra cost.
Examples abound, but two others are ride-sharing company, Uber and room-sharing company Airbnb. By creating free, simple, highly intelligent smart phone apps, these companies helped put idle capital to work, bringing a massive supply of car rides and rentable rooms to an efficient online market.
This increase in supply against the existing demand is generating downward pressure on the prices of car rides and rentable rooms. Anecdotally, a recent $150 taxi ride from airport to hotel cost only $55 on the return trip with UberX.
This is the essence of the smart phone economy. These technologies are highly sophisticated and require massive amounts of computing power; yet critical to their success is their ability to be used on a smart phone. These types of businesses and the deflationary pressure they generate are only possible through the quantum advances made in transistors and the microprocessors that house them.
There are of course many factors that contribute in various degrees to the rate of economic inflation; trying to attribute it to just one of them is probably a fool’s errand. At the same time, it seems unlikely to be mere coincidence that the slowing of the dollar’s dilution has occurred with the accelerating concentration of per-unit (of size and cost) computing power:
THE BEGINNING OF THE END?
While not without some deviations along the way, Moore’s law has proven largely reliable over the last 40 years. In 2016, however, industry experts are suggesting that Moore’s law may be coming to an end, or is at the very least slowing. The reasons behind this are related to both physics and economics.
The exponential increase in per-unit computing power has been directly related to the decreasing size of transistors. This process has pushed the size of transistors increasingly closer to their fundamental limit of smallness, namely the size of the atom.
The first transistor made in 1947 was about the size of the human hand. Today, transistors are being made at widths of 100 atoms - millions could fit on the period at the end of this sentence. At such small dimensions, subsequent reductions in size become more difficult to create and the marginal benefit diminishes. Moreover, as their production becomes more complicated, it also becomes more expensive.
If Moore’s exponential curve does indeed begin to level off, what might that mean for inflation? After nearly five years of trending higher, the U.S. dollar appears to be taking a breather in early 2016. After 18 months of decline, the price of oil seems to have stabilized between $30 and $40.
Over the last several months, core CPI (ex-food and energy) has trended steadily higher while headline CPI has oscillated between positive and negative territory, reflecting the volatility of oil prices:
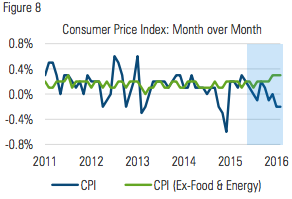
A continued stabilization or increase in the price of oil along with a sustained decline in the value of the dollar, coming together with the end or slowing of Moore’s law could create the perfect storm for a reversal in the long-term trend of falling inflation.
If inflation does indeed begin to surprise to the upside, investors will do well to have limited exposure to longer-term fixed rate bonds and greater exposure to equities. To the extent that higher inflation might lead to higher volatility, we believe managed risk portfolios offer a compelling solution to maintaining equity exposure while seeking to constrain volatility and protect against sustained market declines.

Milliman Financial Risk Management LLC is a global leader in financial risk management to the retirement savings industry. Milliman Financial Risk Management (FRM) provides investment advisory, hedging, and consulting services on $169 assets.
Established in 1998, the practice includes over 140 professionals operating from three trading platforms around the world (Chicago, London, and Sydney). Milliman FRM is a subsidiary of Milliman, Inc.
Milliman, Inc. (Milliman) is one of the world’s largest independent actuarial and consulting firms. Founded in Seattle in 1947, Milliman has 55 offices in key locations worldwide that are home to over 2,600 professionals, including more than 1,300 qualified consultants and actuaries.
for more information:
MILLIMAN.COM/FRM
FOR INVESTMENT PROFESSIONAL USE ONLY
Recipients must make their own independent decisions regarding any strategies or securities or financial instruments mentioned herein.
The products or services described or referenced herein may not be suitable or appropriate for the recipient. Many of the products and services described or referenced herein involve significant risks, and the recipient should not make any decision or enter into any transaction unless the recipient has fully understood all such risks and has independently determined that such decisions or transactions are appropriate for the recipient.
Any discussion of risks contained herein with respect to any product or service should not be considered a disclosure of all risks or a complete discussion of the risks involved.
The recipient should not construe any of the material contained herein as investment, hedging, trading, legal, regulatory, tax, accounting or other advice. The recipient should not act on any information in this document without consulting its investment, hedging, trading, legal, regulatory, tax, accounting and other advisors. The materials in this document represent the opinion of the authors and are not representative of the views of Milliman, Inc. Milliman does not certify the information, nor does it guarantee the accuracy and completeness of such information. Use of such information is voluntary and should not be relied upon unless an independent review of its accuracy and completeness has been performed. Materials may not be reproduced without the express consent of Milliman.
MIL_COM_1 4/16_4/17
© 2016 Milliman Financial Risk Management LLC


