KEY TAKEAWAYS
- The importance of earnings for EM companies is often overshadowed by macro considerations.
- As with most other regions, EM earnings disappointed markets recently.
- Analysts have recently been revising earnings upward, and not merely in commodity-oriented sectors.
After disappointing investors last year, emerging market earnings forecasts may finally be consistent with what can be delivered. Emerging markets (EM) have underperformed U.S. markets since the summer of 2011. The reasons are numerous, including concerns about the Chinese economy (the largest and most important among EM), the strength of the U.S. dollar, and the decline in commodity prices, just to name a few. However, there is some reason to believe this trend might be reversing. Macroeconomic and political considerations tend to dominate the conversation around the asset class. We will address certain economic considerations, especially the impact of currency movements on the asset class, in an upcoming Weekly Economic Commentary. Here we focus on what we believe is the improving earnings picture for the asset class. Though the recent improvement appears to be partially due to stability in commodity prices, the revision in earnings estimates extends far beyond commodities and into consumer and technology companies.
DISAPPOINTMENT AND DOWNGRADES
The nature of EM tends to excite investors. Global investors are eager to capitalize on the prospect of hundreds of millions of people in China or India buying their first smartphone or their first car. The reality can be more sobering. Historically, when EM do well, they have the potential to outperform the U.S. for years, by hundreds of basis points each year. But when they disappoint, the performance gap between emerging and developed markets can be equally large.
Earnings still matter for EM. As the U.S. economic recovery and bull market began to age, investors became increasingly optimistic on earnings growth outside of the U.S., and therefore on those equity markets. Yet, actual earnings were much lower than expectations, resulting in a massive negative earnings surprise for the fourth quarter of 2015. Furthermore, analysts reduced expectations for future earnings growth. The estimated earnings growth for EM in 2016 is currently 9.4%, down from 34% that was projected at the end of the third quarter of 2015 [Figure 1]. EM investors may be less sensitive to quarterly estimates, as most companies tend to release data throughout the quarter, as opposed to U.S. companies where most announcements are made within a three- to four-week period.
However, as we approached the start of this quarter’s earnings season, the investment community has become more optimistic regarding EM earnings. One important difference—though at times difficult to measure—between emerging and developed markets is the degree of political and economic uncertainty. By definition, there are more questions about EM companies than their developed market peers. Differing accounting standards, the impact of changing government policy, currency volatility, and many other factors make examining earnings more difficult. As a rule, EM equities trade at a valuation discount to developed markets. The key to investing in EM is to ask if the current valuations warrant accepting the additional risk.

WHERE DOES THE GROWTH COME FROM?
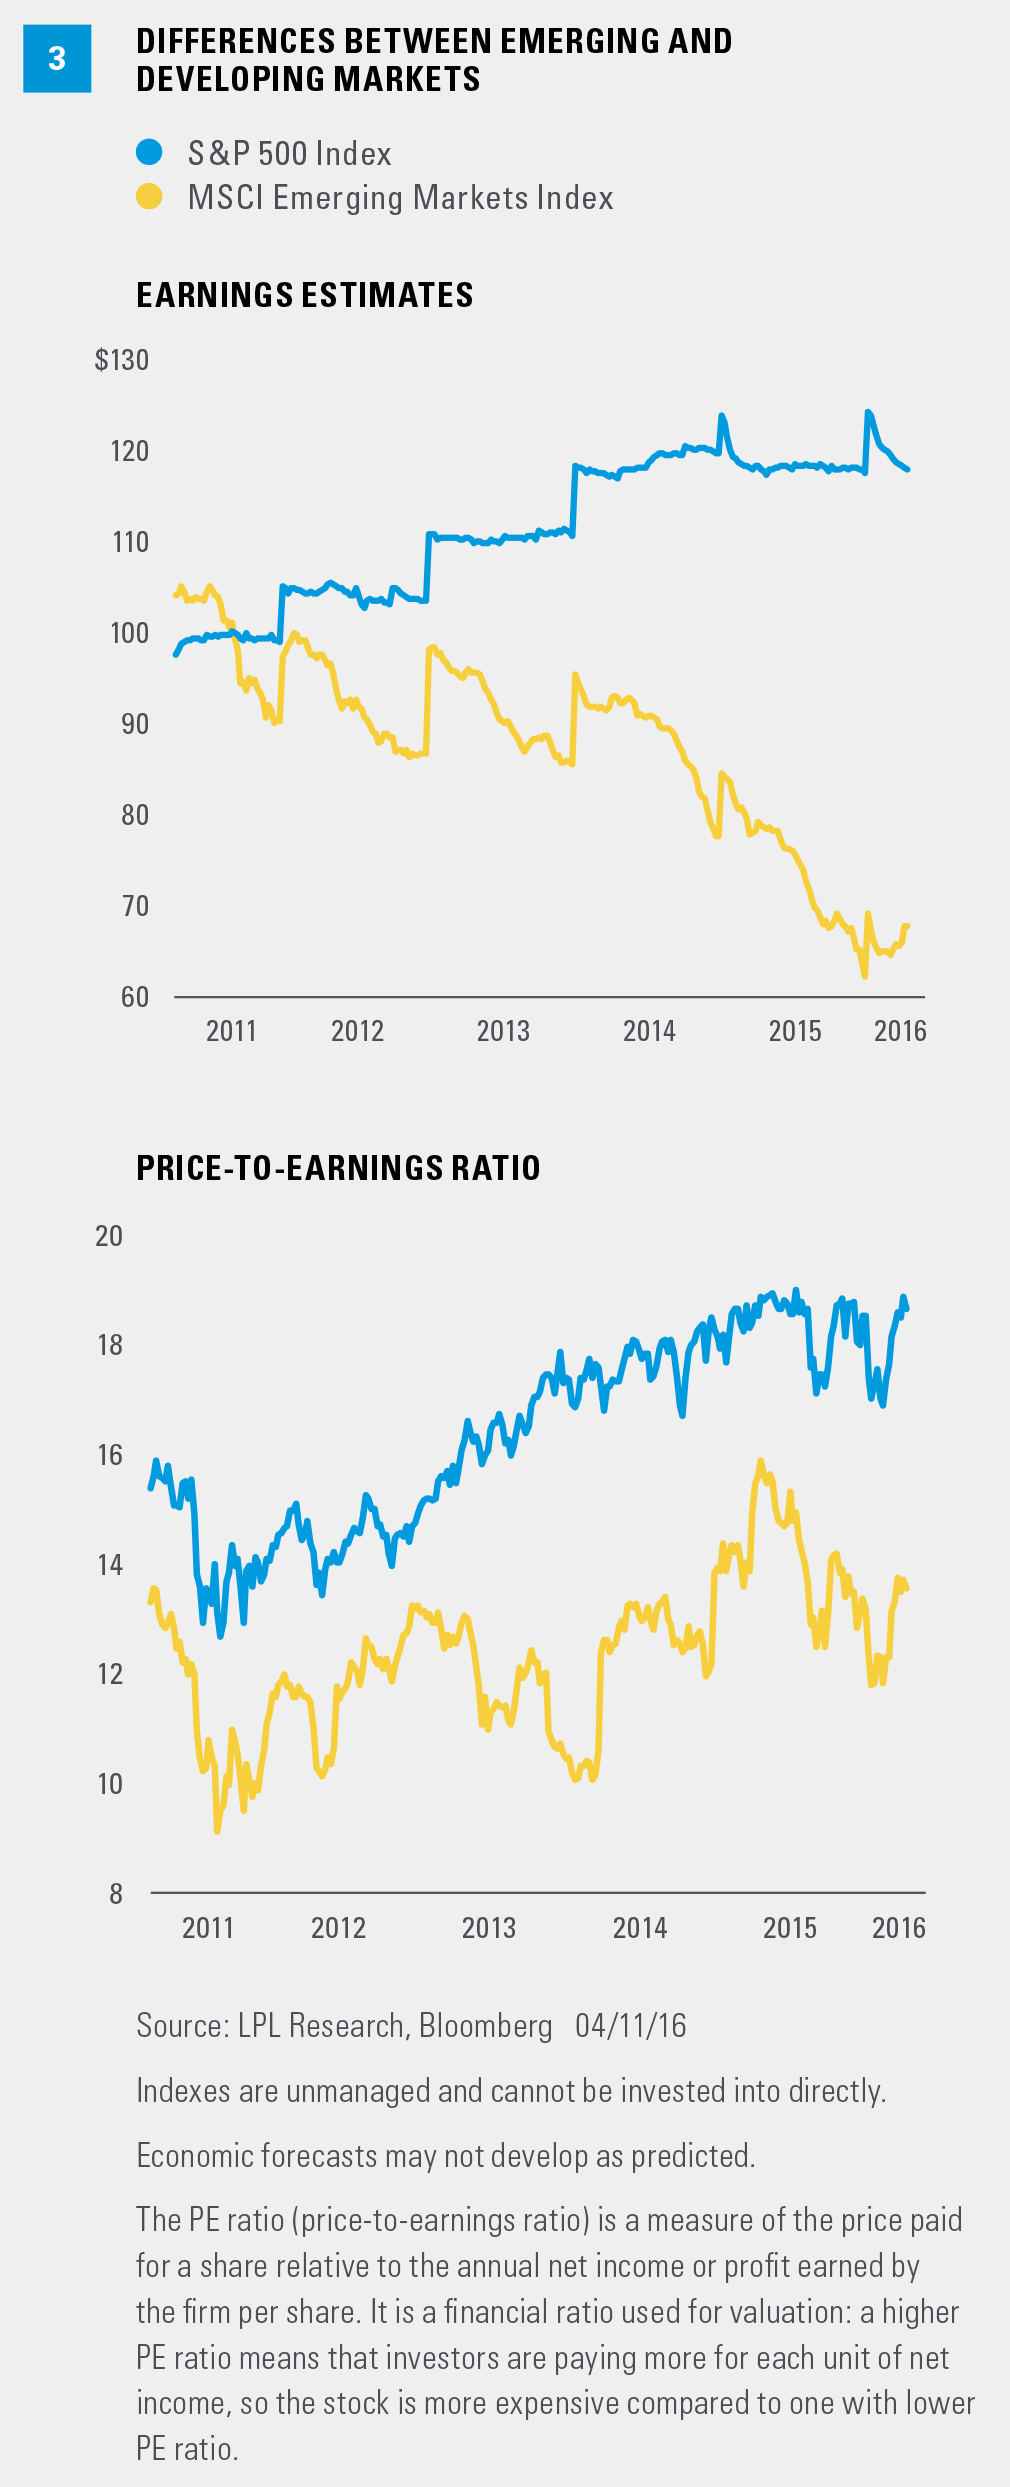
Emerging markets have a very different composition than developed markets. Historically, they have been heavily dependent upon commodity export-oriented companies. These sectors are still important for the asset class, more so than for developed markets [Figure 2]. Commodities are not just important to EM as a source of corporate profits, but also as a fuel for their economies as a whole. Countries like Brazil and Russia use commodity exports to support their economies and help fund government operations. Analysts began to revise their earnings forecasts upward right around the time that the oil market began to stabilize and rebound [Figure 3].
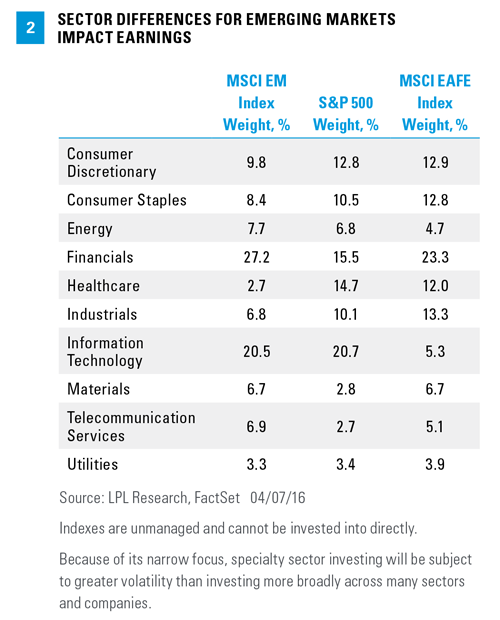
However, the increased optimism for earnings extends far beyond commodities. Across the entire asset class, earnings expectations have been trending up for 7 of the 10 equity sectors, including important areas like technology and consumer-related sectors. Despite increased stability in oil prices, earnings estimates have not been increased for energy companies. Financials, one of the key sectors within EM, has seen stability in earnings estimates, but has not seen an increase.
As always, the important part of evaluating data—whether it is earnings, economic data, or anything else—is the all-encompassing question “What’s priced in?” The bottom half of Figure 3 shows that forward price-to-earnings (PE) ratios for EM have not expanded much since the financial crisis, whereas valuations for the S&P 500 have increased significantly. Yes, earnings for U.S. companies have been better, but this is already factored into the PE ratio. To us, the current low valuations suggest not only pessimism on corporate earnings, but also on macroeconomic and political factors. Should we see more improvement, the EM asset class would indeed look very attractive.
CONCLUSION
By itself, increased investor confidence in EM companies is not sufficient to warrant a significant allocation to EM, though aggressive and more tactically oriented investors may decide that is enough to initiate a small position, when suitable. Stability and eventual improvement in corporate earnings are a necessary part of any sustained rally in EM performance. Increased economic stability and clarity on policy, especially in key countries like China, will also serve as confirmation of an “all clear” for the asset class. However, by the time such clarity is received, valuations will likely be higher than they are today. The famous global investor Sir John Templeton suggested that one should buy EM when “there is blood in the streets.” Times have changed and these markets no longer experience the kind of turbulence they did in Templeton’s day. Perhaps this should be changed to buy when there is still “red on the screen.”
IMPORTANT DISCLOSURES
The opinions voiced in this material are for general information only and are not intended to provide specific advice or recommendations for any individual. To determine which investment(s) may be appropriate for you, consult your financial advisor prior to investing. All performance referenced is historical and is no guarantee of future results.
The economic forecasts set forth in the presentation may not develop as predicted and there can be no guarantee that strategies promoted will be successful.
Investing in stock includes numerous specific risks including: the fluctuation of dividend, loss of principal, and potential liquidity of the investment in a falling market.
Because of its narrow focus, specialty sector investing, such as healthcare, financials, or energy, will be subject to greater volatility than investing more broadly across many sectors and companies.
Investing in foreign and emerging markets securities involves special additional risks. These risks include, but are not limited to, currency risk, geopolitical risk, and risk associated with varying accounting standards. Investing in emerging markets may accentuate these risks.
All investing involves risk including loss of principal.
Forward price-to-earnings is a measure of the price-to-earnings ratio (PE) using forecasted earnings for the PE calculation. While the earnings used are just an estimate and are not as reliable as current earnings data, there is still benefit in estimated PE analysis. The forecasted earnings used in the formula can either be for the next 12 months or for the next full-year fiscal period.
INDEX DESCRIPTIONS
The Standard & Poor’s 500 Index is a capitalization-weighted index of 500 stocks designed to measure performance of the broad domestic economy through changes in the aggregate market value of 500 stocks representing all major industries.
The MSCI EAFE Index is recognized as the pre-eminent benchmark in the United States to measure international equity performance. It comprises the MSCI country indexes that represent developed markets outside of North America: Europe, Australasia, and the Far East.
The MSCI Emerging Markets Index captures large and mid cap representation across 23 emerging markets (EM) countries. With 822 constituents, the index covers approximately 85% of the free float-adjusted market capitalization in each country.


