KEY TAKEAWAYS
- “Sell in May and go away” has become cliché, but the data make it difficult to ignore.
- The stock market’s gains through April and the election year pattern provide somewhat encouraging signs for this year’s May to October period.
- “Sell in May” could work; but given our forecast for gains in stocks this year, so might “buy in July.”
“Sell in May and go away” is probably the most widely cited cliché in stock market history. May is upon us, which every year sparks a barrage of Wall Street commentaries, media stories, and investor questions about the popular stock market adage. This week we tackle this widely cited seasonal pattern, but with a couple of twists thrown in to add some new perspective.
WEAKEST TIME OF YEAR
The old stock market adage “sell in May and go away” is based on a seasonal stock market pattern in which the six months from May to October are historically weak for stocks, with the common added belief that you might be better off avoiding the market altogether and moving to cash during the historically volatile summer months. “Sell in May” has naturally given rise to the also popular “Halloween Indicator,” which says to own stocks during the historically strong six-month period from November to April.
Taking a look at monthly returns for the S&P 500 since 1950, along with the past 10 and 20 years, we see that weak performance over the next six months is quite normal. March and April are historically strong, giving way to some potential weakness until the frequent late-year rally [Figure 1].
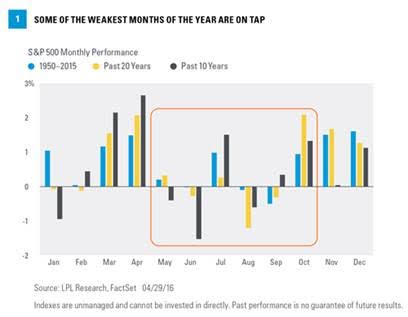
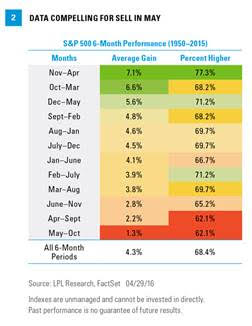
Obviously, those who believe that markets are efficient would dismiss the notion that six seemingly random months should be avoided each year. Then again, going back to 1950, the May to October period is the worst six-month period of the year, while November to April is the strongest [Figure 2]. So, even though “sell in May” may be cliché, and one six-month period must be the worst, we don’t completely ignore it because of how accurate it has been over the long term, although the data do not necessarily suggest selling.
SHOULD YOU SELL NOW?
If you should really “sell in May,” is May 1 the right day to do it? Looking at the average year for the S&P 500 since 1950, the market tends to be strong until early May, consolidates until late October, and finishes with a late-year rally. Interestingly, selling on May 1 has worked well over the past 10 years. In fact, during this period, the S&P 500 has peaked on May 3 on average and hasn’t returned to its early May peak until mid-September [Figure 3].

WHAT ABOUT ELECTION YEARS?
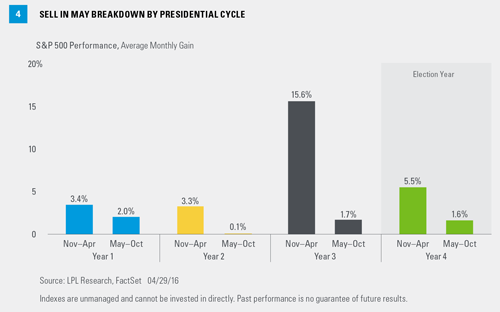
This is a presidential election year of course (the fourth year of the four-year presidential cycle), leading to the question, does “sell in May” work better or worse during election years? The May to October period has typically been good for stocks during election years, with gains 75% of the time since 1950. That makes this year, year four, the most likely May to October period of the election cycle to produce gains. But the average monthly gain during that period in an election year is only 1.6%, slightly better than the 1.3% historical average for all years but behind years one and three in terms of average gains. Only the 0.1% gain seen during the second year of the four-year cycle is weaker than the election year among May to October periods [Figure 4].
Given there have been 16 election years since 1950, the results during the next six months are skewed by the 30% drop in the S&P 500 during the 2008 financial crisis (and we acknowledge all election year studies suffer from small sample sizes). Removing that outlier takes the average May to October performance to a very strong 3.7%. Similarly, the median performance for that time frame during election years is 2.9%, second only to a median gain of 4.0% in the first year of the presidential cycle.
Look for more from us on the election including the election year stock market pattern and our Washington policy outlook in the coming months.
DOES WHERE WE ARE NOW MATTER?
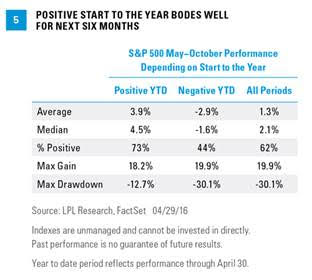
Taking a different angle, we ask, how much does the start to a year matter for the May to October period? Does the market’s direction through April provide clues as to what the next six months might hold? The data suggest it does. When the stock market rises over the first four months of the year, as it did this year (+1.1%), the next six months are up 3.9% on average and are higher 73% of the time. Compare that with the average for all May to October periods (up 1.3% on average and higher 62% of the time) and those when the first four months of the year are down (down 2.9% on average and higher just 44% of the time), and it is reasonable to think the next six months may not be so bad[Figure 5].
CONCLUSION: BUY IN JULY?
Sell in May has become cliché, but the data suggest it is difficult to ignore. The stock market’s gains through April, though modest, and the election year pattern provide somewhat encouraging signs that this May to October period may be above average. So “sell in May” could work again, but given our forecast for gains in stocks this year, so might “buy in July.”
Thank you to Ryan Detrick for his contributions to this report.
Historically since WWII, the average annual gain on stocks has been 7 - 9%. Thus, our forecast is roughly in-line with average stock market growth. We forecast a mid-single digit gain, including dividends, for U.S. stocks in 2016 as measured by the S&P 500. This gain is derived from earnings per share (EPS) for S&P 500 companies assuming mid-to-high-single-digit earnings gains, and a largely stable price-to-earnings ratio. Earnings gains are supported by our expectation of improved global economic growth and stable profit margins in 2016.
IMPORTANT DISCLOSURES
The opinions voiced in this material are for general information only and are not intended to provide specific advice or recommendations for any individual. To determine which investment(s) may be appropriate for you, consult your financial advisor prior to investing. All performance referenced is historical and is no guarantee of future results.
The economic forecasts set forth in the presentation may not develop as predicted and there can be no guarantee that strategies promoted will be successful.
Investing in stock includes numerous specific risks including: the fluctuation of dividend, loss of principal, and potential liquidity of the investment in a falling market.
All investing involves risk including loss of principal.
INDEX DESCRIPTIONS
The Standard & Poor’s 500 Index is a capitalization-weighted index of 500 stocks designed to measure performance of the broad domestic economy through changes in the aggregate market value of 500 stocks representing all major industries.


