Economic Data Underwhelmed in April as Market Valuations Hovered Near 10-Year High
Learn more about this firmEQUITY MARKETS PAUSED IN APRIL AS INVESTORS GAUGED ECONOMIC DATA AND QUARTERLY EARNINGS
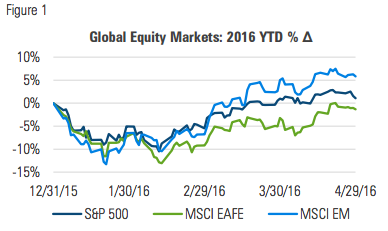
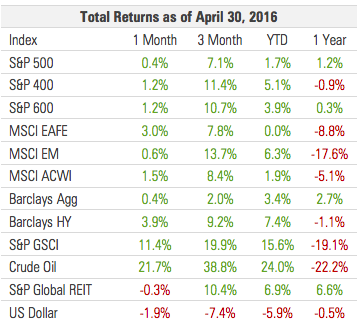
The strong showing from equities in March fizzled out in April as global indices finished the month just marginally higher. The S&P 500 and MSCI EM indices finished the month essentially unchanged while the MSCI EAFE was up 2.5%:
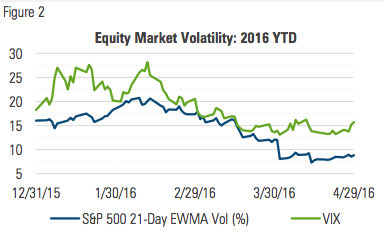
After trending down through much of February and March, volatility leveled off in April and remained low as investors absorbed incoming quarterly earnings data:
MANAGED RISK PORTFOLIOS
During April, we estimate that a typical 70/30, globally-diversified multi-asset portfolio* with a 10% volatility target increased its net equity allocation from approximately two-thirds to its full equity target level of 70%.
The increased equity exposure came as markets exhibited volatility levels at the lower end of their longer-term range. With an average equity allocation of about 50% year-to-date, we estimate the portfolio has participated in about two-thirds of the max drawdown and less than two thirds of the volatility of an unhedged counterpart.
Managed risk portfolios are often discussed within the context of volatility reduction and downside protection. Perhaps less often discussed is why these matter and who they matter for. Figure 3, which plots rolling 21-day returns against their corresponding rolling 21-day volatility over the last 25 years, may be helpful in addressing those questions:
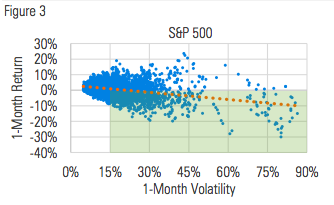
Over the full 25-year period, the volatility (i.e. annualized standard deviation) of the S&P 500’s daily returns was 18%. Within that time frame, however, measures of 1-month volatility ranged from 4.8% at the low end to 86.3% at the high end. The trend line in the scatterplot chart indicates that periods of higher S&P 500 volatility have tended to be biased toward lower returns.
Out of the 6,283 periods examined, 1,663 (27%) have volatilities higher than 18%. Here are some return statistics of that subset of periods that exhibited above average volatility:
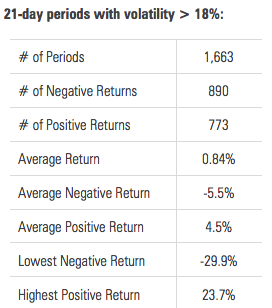
With respect to the returns of the S&P 500, the higher end of their volatility spectrum is influenced more by negative returns, as characterized by:
- A higher number of negative returns than positive returns
- An average negative return that is farther from zero than the average positive return
- A lowest negative return that is farther from zero than the highest positive return
One of the objectives of managed risk funds is to minimize the participation in negative market returns by seeking to manage to a specific volatility target. This is accomplished by dynamically adjusting the equity allocation – higher when volatility is low and lower when volatility is high.
By reducing equity exposure during periods of high volatility, managed risk funds mitigate the disproportionate effects of negative market returns on the value of their portfolios.
While a managed risk approach can be attractive to a wide variety of investor types, its appeal is arguably strongest to those who are living off the income from their investment portfolios. By maximizing equity exposure only after first controlling for risk, a risk managed approach can help to stabilize a portfolio’s value while also helping extend its life beyond that of a traditional fixed allocation of stocks and bonds.
MARKET COMMENTARY
Markets pushed broadly higher in April, although not with the same strength they exhibited in March. International developed markets lead the way with a 3% return while speculative grade credit outperformed in fixed-income markets.
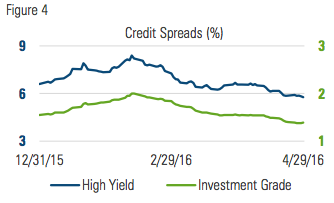
Tightening credit spreads continued to propel returns in both Investment grade and speculative grade fixed income markets:
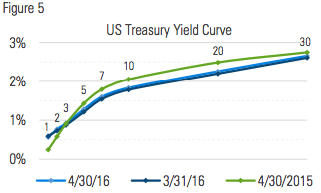
The 10-year Treasury bond yield finished marginally higher on the month, oscillating in a range of 1.7% to 1.9%. The yield curve was also little changed and remains lower and flatter than it was a year ago.
The U.S. dollar as measured by the Bloomberg Dollar Spot Index declined again in April. Over the last three calendar months it is down 7.4%, the largest three-month decline since 2009. The spot price of a barrel of crude oil increased 22% in April to $46.17; since touching its 2016 low on February 11, it has risen 74%.:
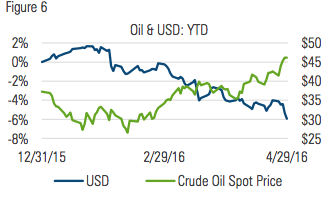
One of the bigger news stories from the second half of the month was the result that came out of the meeting of oil producers in Doha, Qatar. Heading into the meeting it was believed the focus would be on implementing a cap in oil production in an attempt to push up prices. No such agreement was reached, but the price of oil, after falling briefly, continued to rise back to a level not seen since early November.
Oil remains a perplexing question amid efforts to understand what is happening in the global economy. At the end of April, the spot price of one barrel of oil was $46. Against recent history, that seems low, but against a wider historical backdrop, it’s still above a large portion of its longer-term average:
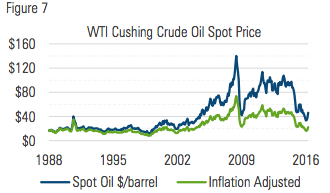
Figure seven shows the nominal price of oil since 1988 as well as the inflation-adjusted price. The inflation adjustment accounts for the dollar’s dilution and shows the effective purchasing power of a barrel of oil relative to 1988.
The annualized rate of inflation since the beginning of 1988 has been 2.6%. In nominal terms, this means that what cost $1 in early 1988 cost $2.06 at the end of April 2016. To think of it another way, the dollar now holds only 48% of the purchasing power it held in 1988.
In spite of the steady the dilution of the dollar’s purchasing power and the recent decline in the price of oil, producers still get more for their oil today than they did in the 1980s, 1990s and early 2000s, in both real and nominal terms.
This becomes all the more interesting when considered against the changing supply and demand dynamics along the way. Figure eight shows global oil production is up nearly 60% since 1985:
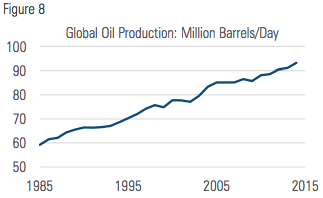
Figure nine shows that increases in air and road travel in the U.S. have exceeded the increase in global oil production, while the fuel consumed to power that travel has increased only marginally as engines have become more fuel-efficient. To put it another way, travelers today need about half the fuel they needed in 1985 to go the same distance:
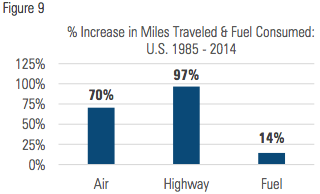
Technological advancement is simultaneously putting upward pressure on supply and downward pressure on demand. Finding and extracting oil is becoming easier, even as the engines that run on it need increasingly less of it.
For all the wild price swings over the past decade, today’s price around $45 may still be too high. How it plays out going forward will create winners and losers and have far reaching implications for economies and financial markets around the globe.
The rapid changes happening in energy markets are a microcosm of the changes happening in nearly every facet of human endeavor. As the rate of change increases it becomes more difficult to predict the outcomes. For investors, rapid change can represent both greater opportunity and risk. In a world where change seems to be the only constant, perhaps one thing that remains is the need to manage change and the risk that invariably comes with it.
Other sources:
US Energy Information Administration
US Department of Transportation, Bureau of
Transportation Statistics
*70/30 Hypothetical Portfolio Index Weights:
35% S&P 500
8.75% Russell 2000, S&P 400
4.375%: Nikkei 225, MSCI EM, FTSE 100, Stoxx 50
30%: Barclays US Aggregate

Milliman Financial Risk Management LLC is a global leader in financial risk management to the retirement savings industry. Milliman Financial Risk Management (FRM) provides investment advisory, hedging, and consulting services on $169 billion assets (as of December 31, 2015).
Established in 1998, the practice includes over 140 professionals operating from three trading platforms around the world (Chicago, London, and Sydney). Milliman FRM is a subsidiary of Milliman, Inc.
Milliman, Inc. (Milliman) is one of the world’s largest independent actuarial and consulting firms. Founded in Seattle in 1947, Milliman has 55 offices in key locations worldwide that are home to over 2,600 professionals, including more than 1,300 qualified consultants and actuaries.
for more information:
MILLIMAN.COM/FRM
FOR INVESTMENT PROFESSIONAL USE ONLY
Recipients must make their own independent decisions regarding any strategies or securities or financial instruments mentioned herein.
The products or services described or referenced herein may not be suitable or appropriate for the recipient. Many of the products and services described or referenced herein involve significant risks, and the recipient should not make any decision or enter into any transaction unless the recipient has fully understood all such risks and has independently determined that such decisions or transactions are appropriate for the recipient.
Any discussion of risks contained herein with respect to any product or service should not be considered a disclosure of all risks or a complete discussion of the risks involved.
The recipient should not construe any of the material contained herein as investment, hedging, trading, legal, regulatory, tax, accounting or other advice. The recipient should not act on any information in this document without consulting its investment, hedging, trading, legal, regulatory, tax, accounting and other advisors. The materials in this document represent the opinion of the authors and are not representative of the views of Milliman, Inc. Milliman does not certify the information, nor does it guarantee the accuracy and completeness of such information. Use of such information is voluntary and should not be relied upon unless an independent review of its accuracy and completeness has been performed. Materials may not be reproduced without the express consent of Milliman.
MIL COM 1 4/16 4/17
© 2016 Milliman Financial Risk Management LLC


