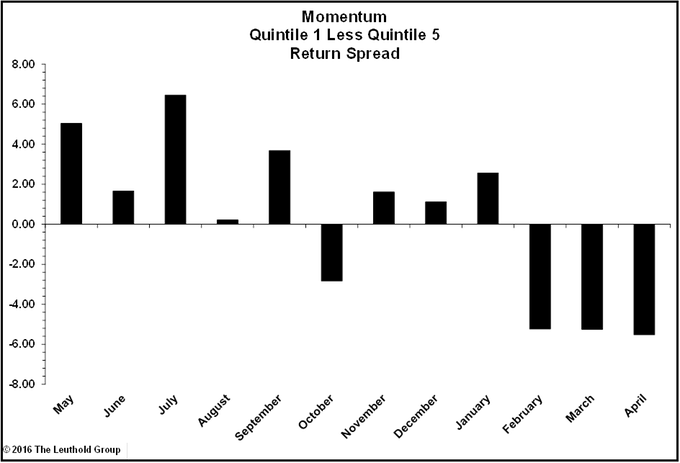
You’ll be forgiven if you think Chart 1 was accidentally left unchanged from last month; broad factor performance is almost identical when comparing March and April. Unfortunately, the repetition hasn’t been constructive for factor investors. Value is the only category that has seen positive performance, and even that was very narrow in April, with Energy and Materials driving the majority of the gains (Financials was also positive).
While similar, April was even more painful than March because Profitability performed much worse, while Value and Growth were slightly worse. Low Volatility, a trade that has become extremely crowded, also continued to underperform. Momentum saw its third consecutive month with a performance spread of –5% (or wider).
CHART 1

Momentum Nightmare
Last month we posted the following data points which marked Momentum’s worst rolling three-month performance since the financial crisis:
- 4/30/2015: -9.8%
- 2/29/2012: -8.6%
- 3/31/2016: -7.9%
- 5/31/2014: -6.3%
CHART 2
While we don’t recommend trying to time Momentum, our conclusion last month was to maintain caution because the factor relies on lower oil prices in order to perform well. Caution proved an accurate stance, as another month of almost identical results pushed the new rolling three-month return to the top of the list as the worst time period (-15.2%, Chart 2) since the crash, the three months ending September 2009.
The rebound in Energy and Materials securities has been the biggest contributor to results. The only sector to be spared from double-digit losses was Health Care, which is +8% over that three-month time frame (Small Cap Biotechnology stocks have continued to decline). As we noted last month, the best quintile of Momentum resides in the 23rd percentile (1=cheap) of historical valuation levels. Given the valuation levels and the pain already incurred, we expect a turnaround to take place in the near future.
Low Volatility Pain
CHART 3
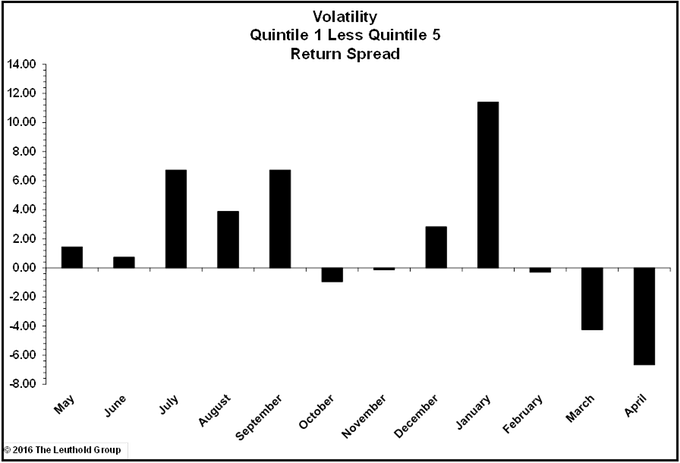
At the end of January we noted that investors had shunned Volatility to a remarkable degree:
“With the recent spike, we’re now approaching levels last seen at the 2009 lows. We don’t doubt this ratio can go higher in the near term, but it’s hard to imagine Low Volatility being a winner from these levels in the long term.”
CHART 4
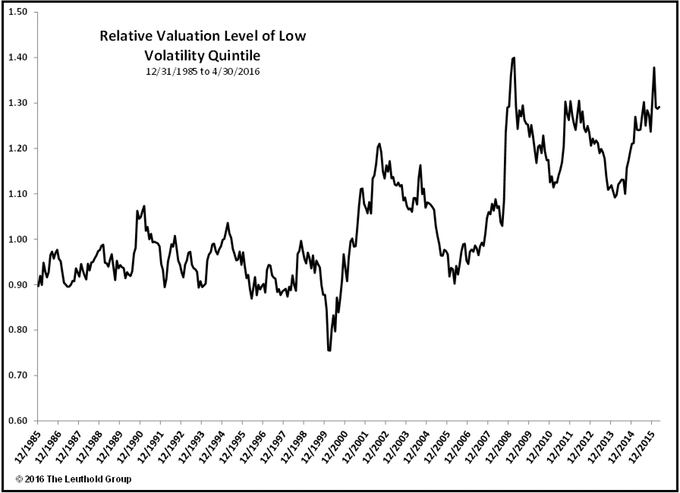
We should have just called the top right there because Low Volatility has struggled ever since, with April turning in performance of –6.7% (Chart 3). So was that it? While we doubt the correction continues unabated, there is more room to move lower. Despite the recent pull-back, the relative valuation level of the strategy remains at historically high levels (Chart 4). Investors of late have been piling into the so-called “safe” corners of the market. Whether it happens in an up or down market, typically this type of crowding does not have a happy ending.


