We have seen a pretty sizable bounce back in the high yield market off of its February 11th lows, with spreads declining and prices rising.1
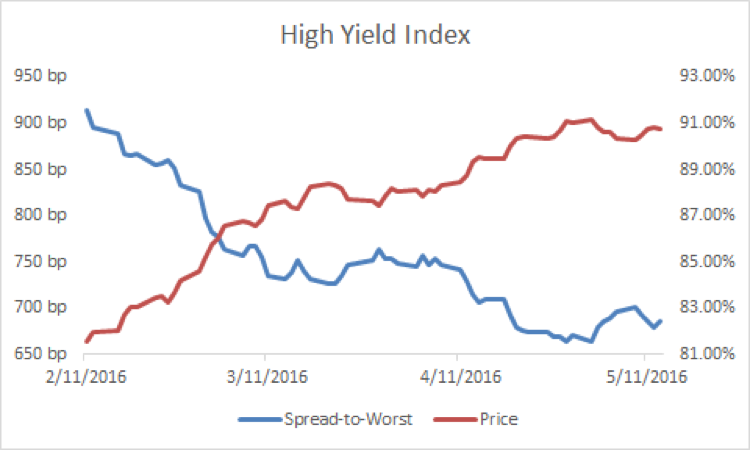
This leads to the question, have we come too far too fast? We believe that answer to that is no. While of course there may be periods of stepping back, as is natural, and healthy, in any market, we believe there is still room for the high yield market to run up further from here.
Spreads are nowhere near their historical cyclical lows, either seen this cycle or in past cycles, nor are they near historical averages. First, let’s look at this cycle.2
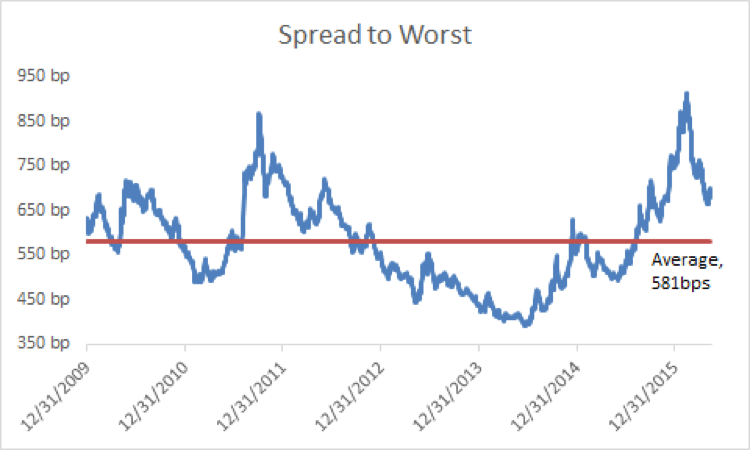
Since the end of 2009, the average spread to worst on the high yield index is 581bps, with a high spread level of 914bps on 2/11/16 and a low of 391bps on 6/23/14. This compares to a current spread to worst level of 685bps, meaning there is currently over 100bps of premium versus this cycle’s average.
If you look at this relative to the history of the high yield market, going back to 1986, and including prior periods when we saw massive spikes in 2008 that skew the averages upwards, our current spread level of 685bps compares to a 30 year average of 586bps and 30 year median of 531bps.3
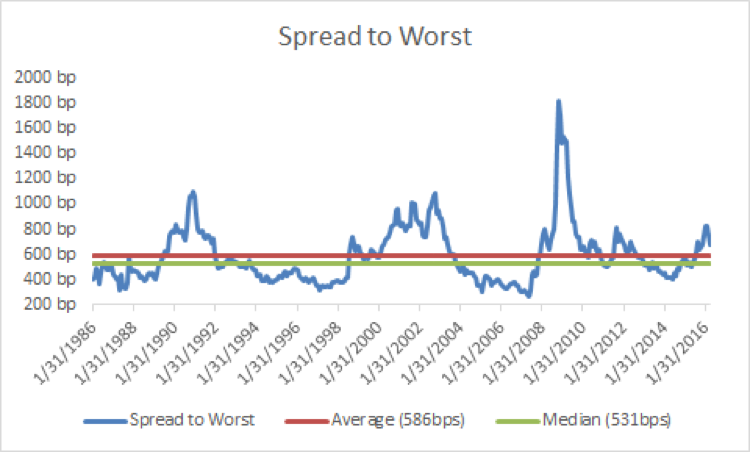
So relative to history, today’s high yield market does not seem expensive as we are still sitting above these averages and medians.
But this “value” assessment needs to be in the context of also looking at risk, and we view defaults as that primary risk. As we have discussed before, default rates in the high yield market as a whole were undoubtedly expect to increase this year. And we are certainly seeing that with total high yield default rates now hitting the 5% mark. However, defaults by and large have been contained to the commodity sectors (energy, metals/mining). We are currently seeing a slew of energy players missing coupons and undertaking debt for equity exchanges, and some of these are huge players in the high yield market (thus in the indexes and index-based products). For instance, Linn Energy defaulted on $5.7bil in bonds and $0.5mm in loans, Peabody Energy on $4.8bil in bonds and $1.2bil in loans, and rounding out the top three defaults year-to-date, Sandridge Energy on $3.6bil in bonds. However, outside of the commodity space, issuer default rates haven’t moved much over the past few years and remain near historical lows.4
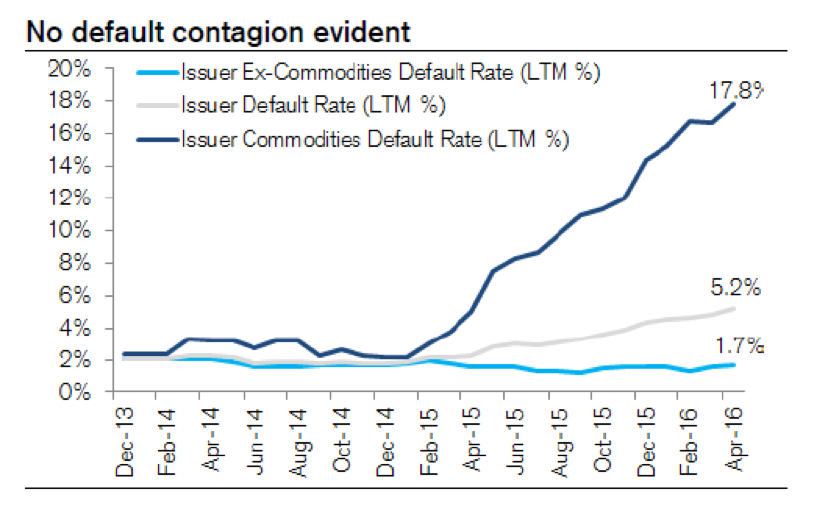
So while we believe we have seen contagion on the pricing side, with the concerns in the energy space leading to the entire market being priced down late last year into early 2016, we are not seeing contagion on the default side. Credit Suisse is projecting default rates to rise to 6% by early next year, peaking in early 2017, and then falling.5 They also note that historical high yield market bottoms (whereby the cycle yield highs are hit) have proceeded the spikes in defaults by about 12 months during past cycle peaks.6 If history holds, this means that if default rates were to peak for this cycle in Q1 2017, then we would have presumably seen the peak in yields in Q1 of this year. Only time will tell, but we do know markets are forward looking mechanisms and given the problems in the energy sector, expectations for defaults to rise are well telegraphed.
On the technical side, we have seen things improve with both strong inflows and issuance up over the last three months since the February low, which indicates that people are coming back and embracing the asset class. But this hasn’t been a one way trade, with some periods of notable outflows over the past couple weeks, which we would view as a healthy market. Like any market, you see these ebb and flow, but overall prices and spreads have held in well since hitting these recent highs.
While there will be periods of ups and downs, we believe that we are still in the midst of a recovery in the high yield market. We have seen a swift rebound in commodity related names over the past few months, with the energy sector now up 13.3% and metals and mining up 17.8% year-to-date, which has undoubtedly helped the reported YTD total high yield return of 6.8% given together these are a sizable portion of the index.7 However, we have seen much less significant moves in other sectors, with many names in the broader high yield market still trading at what we see as attractive yields and with bonds at discounted prices, which we believe still provides ripe picking for active investors looking for value in this asset class.
We have growing confidence we have seen the bottom in oil prices and while the energy and commodity rebound has helped bond prices, it has come too late and still leaves prices too low for many producers and servicers, which leads to the expectations for defaults to continue to accelerate over the next year. As defaults mount, we would expect that to have an impact on the performance for the index-tracking products that have a sizable exposure to commodities, given the underlying indexes have notable commodity exposure. We believe this is an environment where active management can separate itself and those that are able to lessen their exposure to this risk will outperform. We believe there is still attractive income and value to be had in this asset class for fundamentally focused investors.
1 Data sourced from Credit Suisse. Historical spread and price data covers the period from 2/11/20166 to 5/12/2016. The Credit Suisse High Yield Index is designed to mirror the investible universe of the $US-denominated high yield debt market. “Spread” referenced is the spread-to-worst.
2 Data sourced from Credit Suisse. Historical spread data covers the period from 12/31/2009 to 5/12/2016. The Credit Suisse High Yield Index is designed to mirror the investible universe of the $US-denominated high yield debt market. “Spread” referenced is the spread-to-worst.
3 Data sourced from Credit Suisse. Historical spread data covers the period from 1/31/1986 to 5/12/2016. The Credit Suisse High Yield Index is designed to mirror the investible universe of the $US-denominated high yield debt market. “Spread” referenced is the spread-to-worst.
4 Fer Koch, Miranda Chen, James Esposito, and Chiraag Somala, “CS Credit Strategy Daily Comment,” Credit Suisse Fixed Income Research, May 11, 2016, p.2.
5 Fer Koch, Miranda Chen, James Esposito, and Chiraag Somala, “CS Credit Strategy Daily Comment,” Credit Suisse Fixed Income Research, May 11, 2016, p.2.
6 Fer Koch, Miranda Chen, James Esposito, and Chiraag Somala, “CS Credit Strategy Daily Comment,” Credit Suisse Fixed Income Research, May 11, 2016, p.3.
7 Data sourced from Credit Suisse, as of 5/12/16. Year-to-date return covers the period from 12/31/2015 to 5/12/2016. The Credit Suisse High Yield Index is designed to mirror the investible universe of the $US-denominated high yield debt market.
Although information and analysis contained herein has been obtained from sources Peritus I Asset Management, LLC believes to be reliable, its accuracy and completeness cannot be guaranteed. Information on this website is for informational purposes only. As with all investments, investing in high yield corporate bonds and loans and other fixed income, equity, and fund securities involves various risk and uncertainties, as well as the potential for loss. Past performance is not an indication or guarantee of future results.


