U.S. Equity Markets Churned Higher Amid Mixed Economic Data and Slowdown in Stock Buybacks
Learn more about this firmU.S. STOCKS NOTCHED THEIR THIRD CONSECUTIVE MONTH OF POSITIVE RETURNS
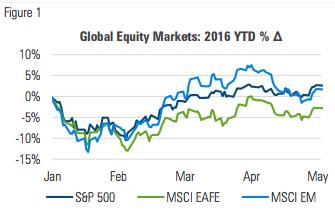
As school let out for the summer, equity markets gave investors reason to cheer, rising by more than 2% during the last week of May:
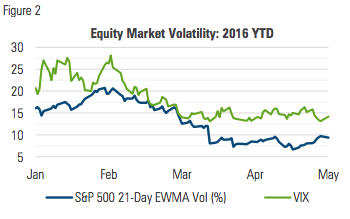
Volatility during the month continued on the path it cut in April, narrowly fluctuating near the lower end of its longer term range:
MANAGED RISK PORTFOLIOS
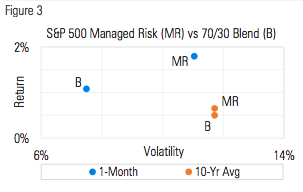
During May, the S&P 500 Managed Risk Index (which has a 0% bond allocation and volatility target of 18%) maintained an equity allocation of 100% and moved in lockstep with the S&P 500 Index for the entire month. This pushed its year-to-date average equity allocation from 75% up to 80%.
The volatility of the S&P 500 Managed Risk Index during May was higher than that of an unmanaged 70/30 stock/bond portfolio, but lower than the trailing 10-year average:
In the years since the financial crisis, the number of investment products and strategies incorporating an explicit risk management component has grown substantially. One such strategy is referred to as low or minimum volatility. As their names suggest, these strategies aim to offer equity market exposure, but with low or minimum volatility.
They seek to deliver low volatility by selecting stocks that have exhibited the lowest near-term volatility and expecting they will maintain that status going forward. While these strategies have often exhibited volatility that is lower than their benchmarks, by no means have they always exhibited “low” volatility.
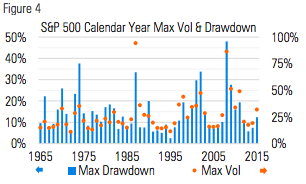
The daily returns of indices that measure the performance of these strategies have been more volatile than their benchmarks between 15% and 20% of the time. Moreover, their max drawdowns exceeded 40% and their volatilities peaked at more than 70%. While that’s lower than their benchmarks, it’s still probably much higher than what many investors expected upon investing in so-called “low vol” products.
The graph in figure four depicts the absolute max drawdown and max 21-day volatility of the S&P 500 for each of the last 50 calendar years. This relationship highlights an important component of risk management. Namely it shows that bigger drawdowns tend to be associated with higher levels of volatility:
Post-2008, the concept of managing investment risk continues to be associated with avoiding crisis-like downturns. Low-vol strategies may often exhibit lower volatility than their benchmark, but there’s no explicit mechanism that prevents them from either exhibiting high volatility or experiencing large drawdowns.
This is where a managed risk strategy differentiates itself. By targeting a specified volatility level and maintaining an ongoing capital protection mechanism, a managed risk approach seeks to manage investment risk in a way that low vol strategies cannot.
This is not to say that low vol strategies have no place in investor portfolios; but to the extent they’re being used with the expectation of both consistently low volatility as well as drawdown protection, investors may end up disappointed.
MARKET COMMENTARY
U.S. equity markets climbed for the third consecutive month, during which time the S&P 1500 generated a total return of 9.4%, marking its best three-month return since the end of 2013. Midcap stocks led the way and extended their outperformance year to date. International developed and emerging markets finished the month lower, but have also returned more than 9% over the past three months.
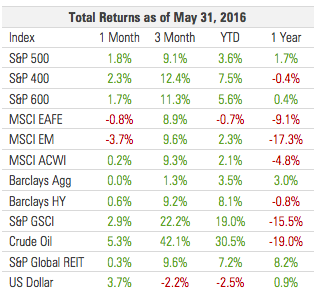
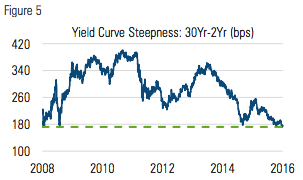
Interest rates traded in a narrow range as investors anticipated the Fed’s June meeting. The short end of the curve edged higher while the long end moved marginally lower. By May 23 the yield curve had flattened to a level not seen since 2008:
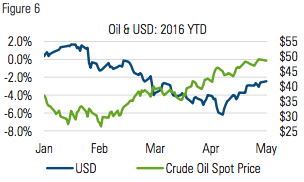
After declining four of the last five months, the U.S. dollar as measured by the Bloomberg Dollar Spot Index rose by 3.7% in May. While public statements by Fed governors left the door open for a rate hike in June, the Fed funds futures market indicated just a 25% chance of an increase in June and 53% chance by July. After falling through most of 2016, the dollar’s rise in May could reflect a growing expectation of continued central bank policy divergence between the U.S. and much of the rest of the world.
During the six-months ended in January 2016, the price of oil was down 55%. Since then it has increased four consecutive months by a total of 46%, even as inventories continue to hover around all-time highs:
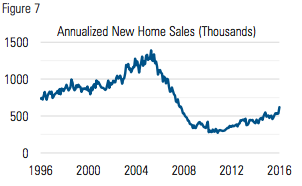
New home sales came in at 619,000, substantially higher than the 523,000 expected. In spite of the largest one-month increase since 1992, new home sales remain well below pre-crisis levels:
STOCK BUYBACKS: BACK TO NORMAL?
After a sharp decline in 2008 and 2009, the amount of yearly stock buybacks has steadily increased. From 2010 through 2015, companies in the S&P 500 repurchased a total of $2.8 trillion of their own stock:
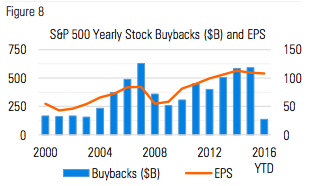
When a company buys back its stock, the shares go into the corporate treasury and no longer factor into the earnings per share (EPS) calculation. All else equal, when buybacks result in a net reduction in shares outstanding, EPS increases.
Representing approximately 25% of the S&P 500’s 2009 year-end market cap, these repurchases from 2010 through 2015 have been a significant source of demand for stocks, and equity investors have benefited from it. Since the end of 2009, the S&P 500 has generated an annualized total return of 12.7%.
That return has been consistent with EPS growth. After recovering to their pre-crisis levels in 2011, S&P 500 EPS steadily climbed through the end of 2014 along with balance sheet cash.
Since then, however, EPS has trended down, cash growth has levelled off and debt has crept higher:
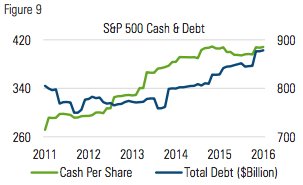
In a broader context, cash still sits near all-time highs and debt loads remain well below pre-crisis levels. As it relates to buybacks, businesses still have room to issue more debt and still hold ample cash to buy back stock.
At the margin however, in the absence of future earnings growth, the willingness of companies to dip into cash for stock buybacks may be diminished.
The most recent data available from Bloomberg indicate that S&P 500 companies have bought back $136 billion of stock year to date through May. If that pace is maintained through the end of 2016, the result will be a 45% reduction from the amount spent in 2015, exceeding the buyback decline in 2008.
To the extent that diminished corporate demand translates into diminished investor confidence, higher market volatility may ensue. With such persistently low interest rates, though, investors can hardly afford to not maintain exposure to the growth potential that equities offer.
In an ongoing environment such as this, risk management remains a cardinal component of managing financial assets.

Milliman Financial Risk Management LLC is a global leader in financial risk management to the retirement savings industry. Milliman Financial Risk Management (FRM) provides investment advisory, hedging, and consulting services on $169 billion assets (as of December 31, 2015).
Established in 1998, the practice includes over 140 professionals operating from three trading platforms around the world (Chicago, London, and Sydney). Milliman FRM is a subsidiary of Milliman, Inc.
Milliman, Inc. (Milliman) is one of the world’s largest independent actuarial and consulting firms. Founded in Seattle in 1947, Milliman has 55 offices in key locations worldwide that are home to over 2,600 professionals, including more than 1,300 qualified consultants and actuaries.
for more information:
MILLIMAN.COM/FRM
Recipients must make their own independent decisions regarding any strategies or securities or financial instruments mentioned herein.
The products or services described or referenced herein may not be suitable or appropriate for the recipient. Many of the products and services described or referenced herein involve significant risks, and the recipient should not make any decision or enter into any transaction unless the recipient has fully understood all such risks and has independently determined that such decisions or transactions are appropriate for the recipient.
Any discussion of risks contained herein with respect to any product or service should not be considered a disclosure of all risks or a complete discussion of the risks involved.
The recipient should not construe any of the material contained herein as investment, hedging, trading, legal, regulatory, tax, accounting or other advice. The recipient should not act on any information in this document without consulting its investment, hedging, trading, legal, regulatory, tax, accounting and other advisors. The materials in this document represent the opinion of the authors and are not representative of the views of Milliman, Inc. Milliman does not certify the information, nor does it guarantee the accuracy and completeness of such information. Use of such information is voluntary and should not be relied upon unless an independent review of its accuracy and completeness has been performed. Materials may not be reproduced without the express consent of Milliman.
MIL_COM_1 5/16_5/17
© 2016 Milliman Financial Risk Management LLC


