“Apples, meet Oranges.” “Oranges, meet Apples.” That is how the conversation needs to start for most media articles on hedge fund industry performance. As is the case in “Hedge Funds Set for Worst First Half Since ’11 on Turmoil”. As is usually the case, the article compares the returns of the hedge fund industry to the S&P 500. The often quoted Hedge Fund Research, Inc. (HFR) database, which is the most institutionally used benchmark provider for hedge fund performance, is not well understood by the media.
The hedge fund universe is a large basket of strategies, which includes equity securities and non-equity securities. In addition, the vast majority of strategies are hedged to some degree so that their exposure to the markets in which their securities reside are not 100%. Of the index quoted in the article for the year-to-date performance, the HFRX Global Hedge Fund Index is an index that currently consists of 39 managers and is “comprised of all eligible hedge fund strategies; including but not limited to convertible arbitrage, distressed securities, equity hedge, equity market neutral, event driven, macro, merger arbitrage, and relative value arbitrage.”
The Bloomberg chart in the article appears to cite an index that is incorrectly labeled. It actually appears to be the HFRI World Index (HFRIWRLD), which consists of funds with no greater than 50% exposure to any specific geographic region. So is it fair to compare either of these to the S&P 500? To help with a more fair comparison, we show below the performance of multiple indices and data points. In addition to the HFRX Global Hedge Fund Index (HFRXGL) and the HFRI World Index, we show the HFRI North American Hedge Fund Index (HFRINA), which consists of funds with at least 50% of their investments in North America and includes all strategy types, not just equity related. Finally, we show the performance of managers classified as Hedged Equity that are also North American focused (HFRIEH US). While HFR does not currently break these managers out into a distinct index, the performance comparison of this equal weighted group should be a much better comparison to the S&P 500, if one wants to compare Apples to Apples.
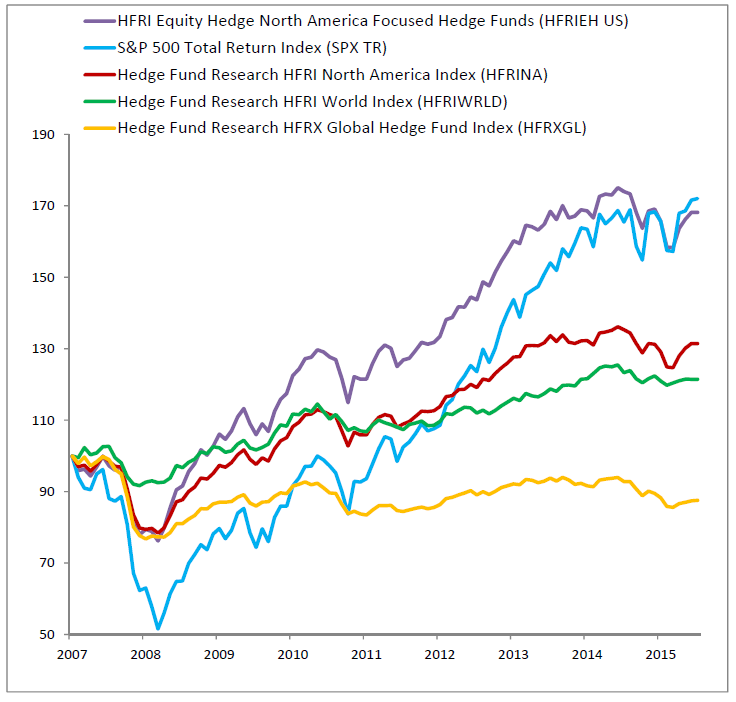
Chart source: HFR Database
If you notice, the performance over the period of time analyzed in the article shows that the performance of the North American focused long/short equity hedge fund managers nearly matches that of the S&P 500 while doing so with much less drawdown and subsequent run-up. Just what you would expect from a hedged equity portfolio: less downside in market drops and less upside in strong rallies. Academically, you would also expect this to result in a higher Sharpe Ratio. Please see below. Apples meet Apples.

Chart source: HFR Database
*Sharpe ratio is annualized using the BofA Merrill Lynch US 3-Month Treasury Bill Index annualizing at 0.37% over same time frame.