This month added another bizarre chapter to the seemingly endless drop in bond yields. The nonfarm payroll report, generally considered the key economic statistic of the month, came in 100,000 above consensus. Bond yields should have soared on the news, since ordinarily investors would interpret it as a sign of a strengthening economy and sell bonds. Instead, the 30-year Treasury bond advanced, pushing yields down to record lows.
In the days following the report, bonds yields rose a bit, but they are still close to historic lows. For history buffs, the yield on the U.S. 10-year Treasury note, currently around 1.50%, is roughly one-tenth of the all-time peak reached in the early 1980s.
What gives? If the economy is getting better, why are yields still stuck near all-time lows? A combination of factors are contributing, including:
1. Low growth
The simplest explanation is that low rates are a function of slow growth and low inflation, or more succinctly low nominal GDP (NGDP). Over the past half-century the level of NGDP has explained roughly 30% of the variation in long-term rates, according to Bloomberg data. If you look at the chart below, NGDP is currently close to 3%, a historical low, suggesting rates should also be low. However, based on current levels one would expect the yield on a 10-year Treasury bond to be around 4.25%. That would still actually be low by historical standards; clearly something other than low growth is impacting rates.
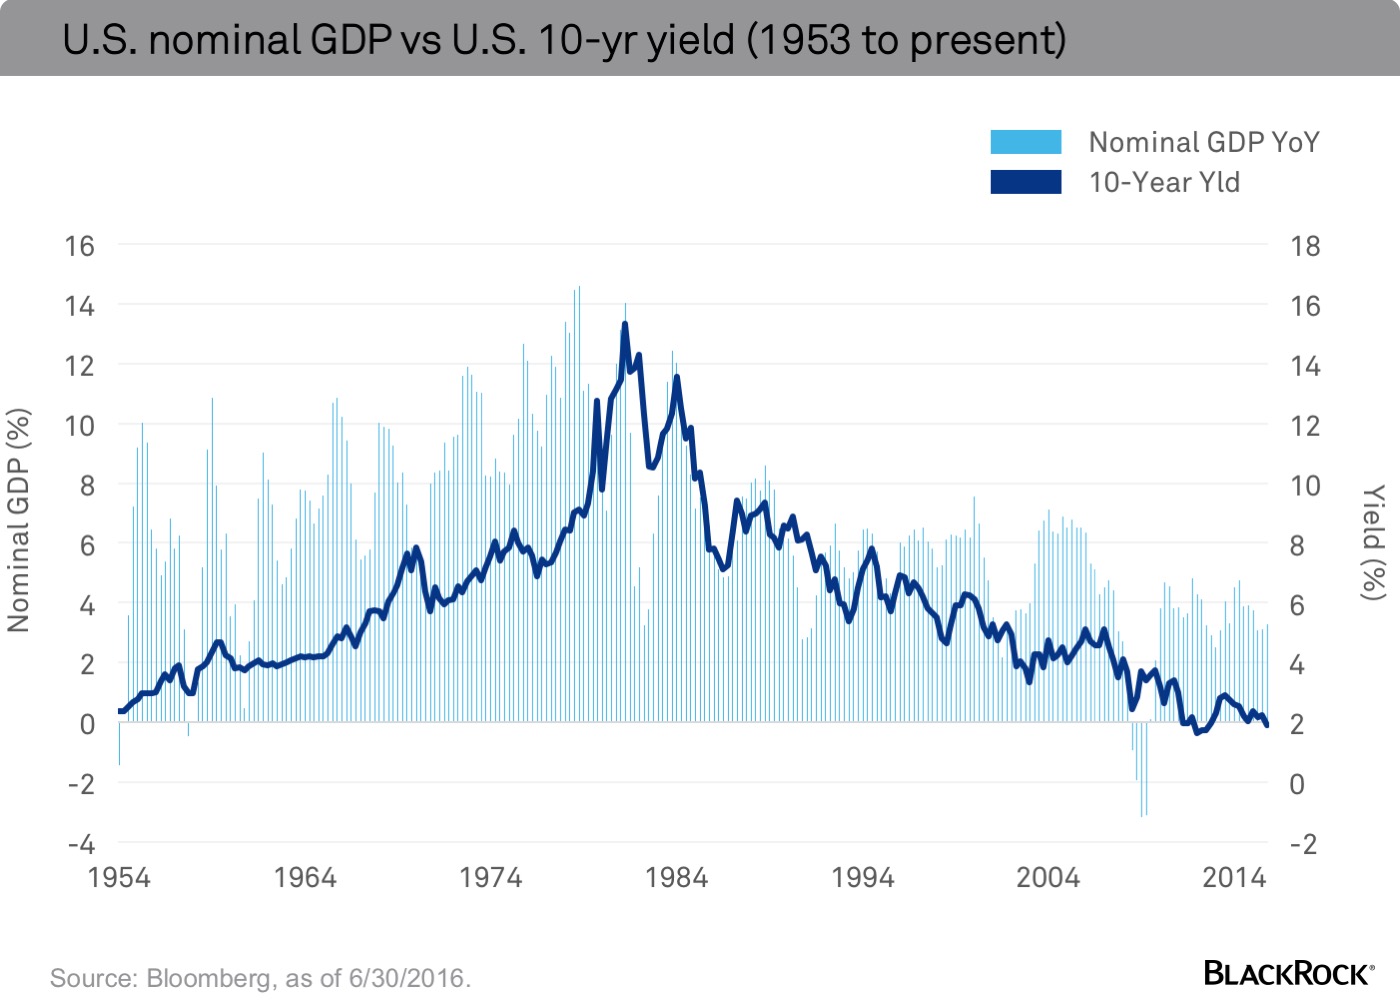
2. Federal Reserve policy
Slow growth has led the Federal Reserve (Fed) to engineer and maintain a policy of extraordinarily low short-term rates. While the expansion is already one of the oldest on record, the U.S. central bank has barely started the process of normalizing rates. With U.S. short-term rates still stuck near zero and the Fed’s balance sheet bloated relative to the pre-crisis norm, bond yields are low by design. Still, it should be noted that if the historical relationship between the Fed Funds rate and the 10-year held, interest rates would be closer to 2.75% rather than 1.50%.
3. The rest of the world looks far worse
Neither the level of nominal growth nor Fed policy fully explain today’s bond yields. Instead, part of the answer lies outside of the United States. Over $10 trillion of sovereign debt currently trades with a negative nominal yield, as Bloomberg data shows. In the context of a global bond market, then, U.S. Treasuries appear to be a bargain. For example, based on monthly Bloomberg data, the historical correlation between German and U.S. 10-year government bond yields has been greater than 95%. This suggests that low global yields are playing a part in keeping U.S. rates down. With German 10-year yields at -0.15%, it becomes easier to understand why U.S. rates are where they are.
There are other factors at work as well: a dearth of bonds, which is a function of both lower deficits and slower accumulation of credit by households, regulatory changes in the wake of the financial crisis and an aging population. The longer-term nature of these suggests ongoing pressure on yields.
Still, should economic data continue to improve, rates are likely to grind higher. And given the historically high duration on most bond indexes, even a modest rise in rates will impose some unpleasant losses on bond holders. But considering the surreal state of the global bond market, there is probably a limit to how far U.S. rates can rise. This low rate environment will be with us for some time to come.
Russ Koesterich, CFA, is Head of Asset Allocation for BlackRock’s Global Allocation Fund and is a regular contributor to The Blog.