KEY TAKEAWAYS
- Our Five Forecasters are collectively sending mostly mid-cycle signals.
- The Leading Economic Index, yield curve, and market breadth are all signaling the continuation of the economic expansion and bull market.
- Stock market valuations and the ISM Manufacturing Index are flashing some warning signs that are worth watching.
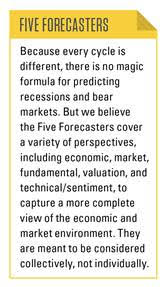
The Five Forecasters favor the continuation of the current economic expansion and bull market. The Five Forecasters are five indicators that, collectively, have historically signaled increasing fragility of the U.S. economy and a transition to the late stage of the economic cycle, with increased potential of an oncoming recession.
Although bear markets (defined as a 20% or more drop in the stock market) are not always accompanied by recessions, more often than not they come together. As a result, we believe these indicators can be used to give some advance warning of a bear market.
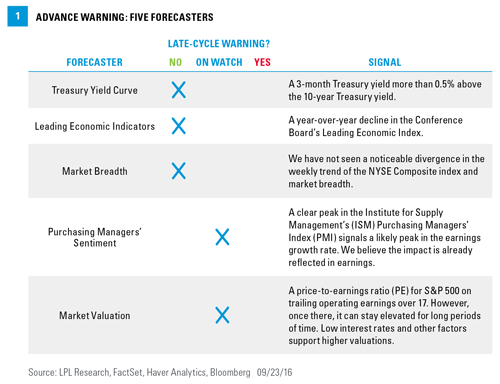
Currently, these indicators are sending mostly mid-cycle signals (similar to our Cycle Clock from our Portfolio Compass publication). Two of the five indicators are flashing yellow and suggest the cycle has moved past the midpoint, as we suspect, while three indicators are still benign [Figure 1]. Here we review these five indicators, which signal that this now seven-and-a-half-year-old bull market may continue.

LEADING ECONOMIC INDEX: NO WARNING
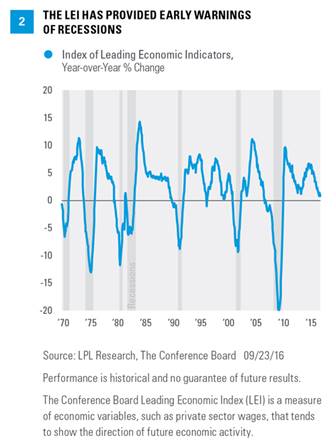
Among the Five Forecasters, the Conference Board’s Leading Economic Index (LEI) provides the best snapshot of the overall health of the economy. The LEI is an aggregate of 10 diverse economic indicators that have historically tended to lead changes in the level of economic activity, including data on employment, manufacturing, housing, bond yields, the stock market, consumer expectations, and housing permits.
The year-over-year change in the LEI has also provided an effective warning signal that the economy might be nearing a recession. When the year-over-year change has turned from positive to negative, a recession has followed in anywhere from 0–14 months with an average lead time of 6 months.
The year-over-year change in the LEI as of August 2016 was +1.1% [Figure 2], suggesting a continuation of the economic expansion that began in 2009. The pace of annual increases has slowed, but that is due mostly to what we view as temporary factors. Should this indicator weaken further and the weakness persist, we would become more concerned. (Look for more on this indicator in this week’s Weekly Economic Commentary.)
TREASURY YIELD CURVE: NO WARNING
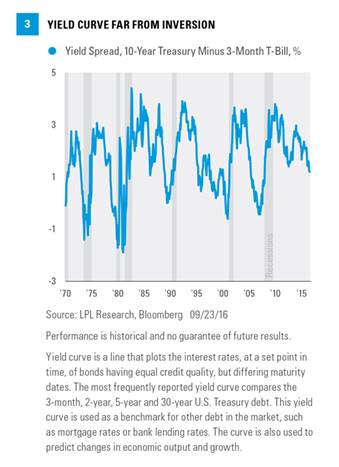
Bull markets have historically ended (and bear markets have begun) when the Federal Reserve (Fed) pushes short-term rates above long-term rates. This is referred to as “inverting the yield curve.” For example, the S&P 500 Index peaked in 2000 and 2007 when the 3-month to 10-year Treasury yield curve was inverted by about 0.5% (3-month Treasury yields were about 0.5% above the yield on the 10-year Treasury note).
In fact, every recession over the past 50 years was preceded by the Fed hiking rates enough to invert the yield curve—7 out of 7 times—a perfect forecasting track record. The yield curve inversion usually takes place about 12 months before the start of the recession, but the lead time ranges from about 5–16 months. The peak in the stock market comes around the time of the yield curve inversion, ahead of the recession and accompanying downturn in corporate profits.
With the 3-month Treasury and 10-year Treasury currently yielding 0.17% and 1.62%, respectively, the Fed must push up short-term rates by nearly 2% to invert the yield curve by 0.5%. Following the Fed’s updated guidance from the conclusion of its two-day policy meeting on September 21, 2016, the Fed does not expect to raise its federal funds rate above 2% until early 2018, suggesting this reliable indicator may not provide a worrisome signal anytime soon [Figure 3].
Some have suggested that the Fed’s zero interest rate policy makes the yield curve a less reliable signal. Using the 2-year Treasury yield (0.75%) instead of the 3-month rate to reduce the Fed impact still provides a benign signal, with more than five rate hikes of 0.25% each required to push the 2-year yield 0.5% above the 10-year at current levels. Even using the 5-year yield (1.16%) would require more than three rate hikes, which may also not come until 2018.
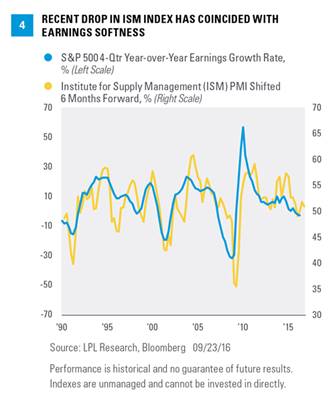
ISM SURVEY: ON WATCH
Earnings are the most fundamental driver of the stock market, and therefore, should be a part of any recession or bear market watch checklist. The Institute for Supply Management (ISM) Manufacturing Index has historically been a good earnings indicator, with a 6-month lead time [Figure 4]. For example, the peak in the ISM that occurred in late 2014 did indicate an ensuing slowdown in profits. The ISM is an association of purchasing and supply management professionals who are surveyed each month to assess their future plans; the results of the survey are then used to create an index. Because purchasing managers are on the front line when it comes to the manufacturing supply chain, they can provide signals ahead of economic turning points. With about two-thirds of S&P 500 profits tied to manufacturing, manufactured goods demand has been a timely barometer of all types of economic activity in recent decades.
Currently, this indicator is signaling a continued earnings lull and is one to watch closely. The latest August 2016 reading was 49.4 (below 50, which indicates contraction). Pulled down by energy sector weakness and a strong U.S. dollar, we believe this weakness is temporary and that readings will soon return to expansion territory. We expect this latest period of earnings weakness to end up resembling the mid-cycle dips experienced in the mid-1980s, mid-1990s, and 2012, periods when the ISM dipped below 50 that were not followed by recession.
There are other earnings indicators that have provided early warning signs of recessions such as profit margin peaks and earnings revisions. These measures, which we will explore more in future commentaries, have also triggered more false signals.
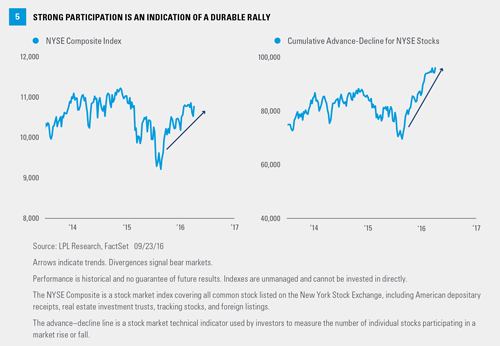
MARKET BREADTH: NO WARNING
We track market breadth by looking at the number of stocks that are advancing versus declining. By tracking how many stocks are participating in a rally, we can get a sense of how broad and durable that rally may be. A market that is rising on the strength of fewer stocks may be more vulnerable to a decline. If market breadth begins to decline and diverge from the rise in the NYSE Composite Index, for example, and is followed by a decline in the index as it begins to succumb to the dwindling number of stocks in the index that are still rising, the likelihood of a market downturn increases (we use the NYSE Composite because of its many constituents).
Most relevant today, a market that is rising on the strength of many stocks is robust and increases the potential of further gains. This is depicted in Figure 5 by both the NYSE cumulative advance-decline line and the NYSE Composite Index trends rising together over an intermediate-term time horizon. We do not see evidence of narrow or weak leadership, nor of concerning divergences between the index and breadth that might suggest the likelihood of a market downturn has increased.
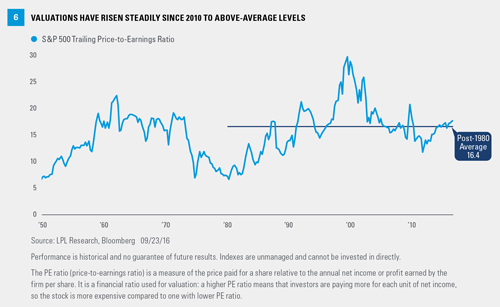
STOCK VALUATIONS: ON WATCH
The statistical relationship between what investors are willing to pay today for earnings over the past year, as measured by the price-to-earnings ratio (PE), and how stocks perform over the following year, is weak, meaning that stock valuations are poor market timing tools (see Weekly Market Commentary, “Sell Now?”). However, the PE is a good indicator of long-term stock returns and can help tell us when the market has become fully valued and may be more vulnerable to deterioration in the economic cycle. A higher PE implies a more optimistic earnings outlook, which introduces more risk of disappointment if that growth outlook does not materialize.
The stock market’s gains this year have lifted the S&P 500 price-to-earnings ratio (PE) to 18 (on a trailing four quarters basis). Though on the high side of the historical range (top quartile) and above the 35-year average (16.4), this valuation is nowhere near what we saw during the internet bubble [Figure 6]. We would characterize the valuation signal as flashing yellow and are watching the four other indicators discussed here, and others, for a catalyst that would make these valuations more worrisome.
CONCLUSION
The Five Forecasters are signaling economic growth and the continuation of the bull market. The yield curve and LEI are sending positive signals, while market breadth offers confirmation of the bull market. Two indicators, PEs and the ISM Manufacturing Index, are flashing some warning signs, but we believe these five indicators, collectively, are signaling a mid-to-late cycle economy and continuation of the seven-and-a-half-year-old bull market. We may see a pickup in stock market volatility and returns may be modest over the next year or two, but our favorite leading indicators and our general assessment of the macroeconomic backdrop suggest more gains for stocks may potentially lie ahead.
IMPORTANT DISCLOSURES
The opinions voiced in this material are for general information only and are not intended to provide specific advice or recommendations for any individual. To determine which investment(s) may be appropriate for you, consult your financial advisor prior to investing. All performance referenced is historical and is no guarantee of future results.
The economic forecasts set forth in the presentation may not develop as predicted and there can be no guarantee that strategies promoted will be successful.
Investing in stock includes numerous specific risks including: the fluctuation of dividend, loss of principal, and potential liquidity of the investment in a falling market.
All investing involves risk including loss of principal.
Because of its narrow focus, investing in a single sector, such as energy or manufacturing, will be subject to greater volatility than investing more broadly across many sectors and companies.
INDEX DESCRIPTIONS
The Standard & Poor’s 500 Index is a capitalization-weighted index of 500 stocks designed to measure performance of the broad domestic economy through changes in the aggregate market value of 500 stocks representing all major industries.
The Institute for Supply Management (ISM) Index is based on surveys of more than 300 manufacturing firms by the Institute for Supply Management. The ISM Manufacturing Index monitors employment, production inventories, new orders, and supplier deliveries. A composite diffusion index is created that monitors conditions in national manufacturing based on the data from these surveys.
© LPL Financial