KEY TAKEAWAYS
- Historically, the best quarter of the year is upon us.
- Although October has been strong recently, we expect the volatility that began in late September to continue.
2016 is a year no one will soon forget. It was the worst start to a year ever for the S&P 500 after 28 trading days (down 10.5%), only to bounce back and actually finish positive by the end of the first quarter. During the second quarter, the bounce in equities continued and the S&P 500 made its first new all-time high in 14 months. After a very volatile first half of the year, in August the S&P 500 traded in its tightest monthly range in more than 20 years. But the “v word”—volatility—has started to come back, as the S&P 500 has closed at least half a percent higher or lower for eight straight days for the first time in eight months, wrapping up the third quarter of 2016.
Adding to the case that 2016 has gone against the norm, the S&P 500 gained 3.4% during the historically weak third quarter, the best third quarter return in three years. What does the fourth quarter hold? With a highly contested election coming (among other big events), it will be anything but boring.
BEST QUARTER OF THE YEAR
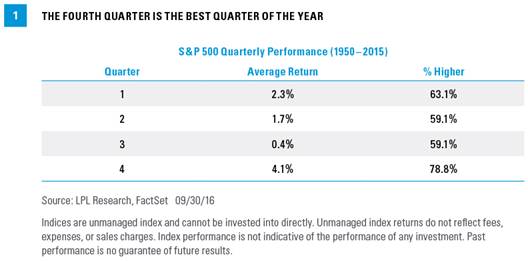
The S&P 500 is up four straight quarters and 13 of the past 15. You have to go back to the mid-1990s to find the last time we saw that. Although this run is impressive, the good news is that historically the best quarter of the year is upon us. Going back to 1950, the final three months of the year are up 4.1% on average and higher nearly 79% of the time – making this quarter the best time for equities [Figure 1]. In general, the first and fourth quarters are the two strongest, while the second and third quarters tend to be weaker.

What about when the fourth quarter follows a strong third quarter? The S&P 500 gained 3.4% in the third quarter of 2016. Going back to 1995, the S&P 500 has gained more than 3% during this historically weak quarter just eight times. The following (fourth) quarter, the S&P 500 finished in the green seven times with an average gain of 5.0%. In fact, the only time it was lower after a strong third quarter was a miniscule 1.0% drop in 2012 ahead of the fiscal cliff drama in Washington, D.C.
OCTOBER HASN’T BEEN SO SCARY LATELY
October has the reputation as one of the most volatile months. In fact, going back to 1950, no month has a wider average monthly range (from low to high), at 7.3%. Also, 24.6% of all the days in October since 1950 have closed up or down at least 1%, again the highest for any month. The bottom line is the volatility that started late last month will likely stick around in October.
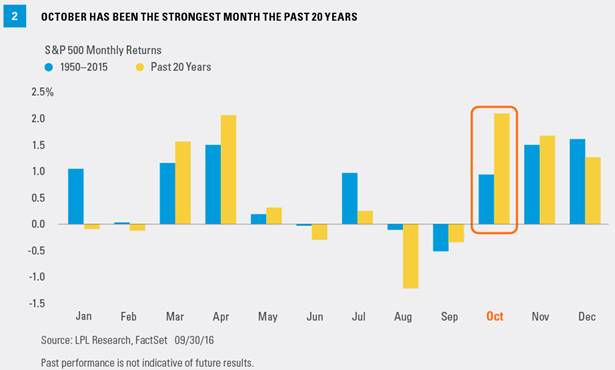
Here’s the good news: October has been very strong lately. In fact, over the past 20 years no month sports a higher average gain, at 2.1%. That is all the more impressive when you factor in the 16.9% drop in 2008. Going back to 1950, October ranks around the middle of the pack month, up 0.9% on average, which ranks seventh out of the 12 months.
As Figure 2 shows, October has been strong recently, but November and December are also historically strong months for stocks.
A CLOSER LOOK AT ELECTION YEARS
This is a presidential election year, so the question of what impact this might have on the stock market always comes up. Well, the fourth quarter of election years has been lower three of the past four cycles, with a huge drop of 22.6% in 2008 mixed in there. But here’s the catch: during election years from 1952–1996, those 12 fourth quarters were all higher. Taking a closer look at those past four cycles, 2000 and 2008 were in the midst or just ahead of recessions, so that played into the weakness those years. With minimal chance of a recession this year based on leading indicators, that increases the odds of the normal historical bullish backdrop returning.
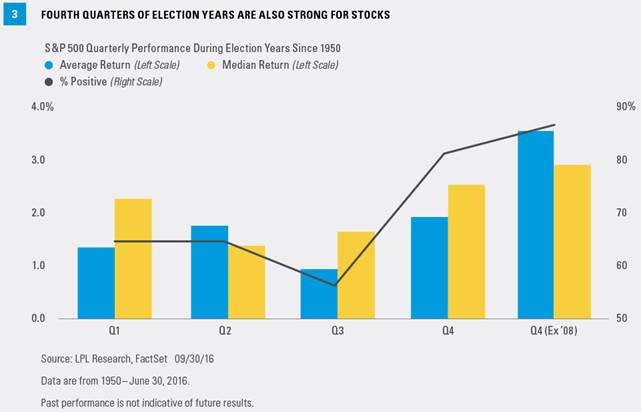
As Figure 3 shows, in all election years since 1950, the fourth quarter is once again the strongest of the year, with an average gain of 1.9%. This is below the average fourth quarter return of 4.1% shown in Figure 1; but if you remove the outlier drop in 2008, this average jumps to 3.5%—more in-line with past performance.
WHAT ABOUT SECTORS?
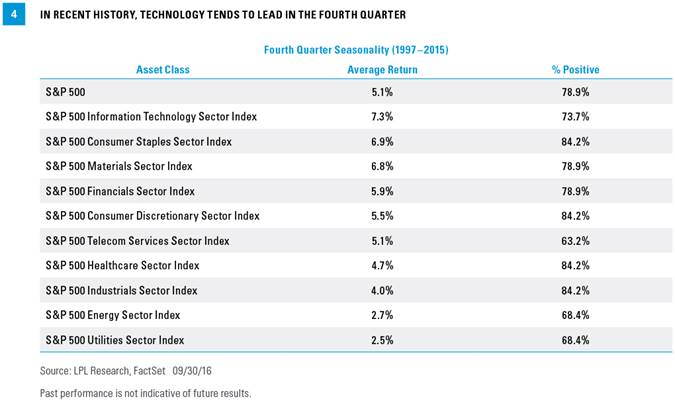
The fourth quarter is usually a strong one for U.S. equities, but what about sectors? Starting in 1997, the top performing sector (based on the S&P 500 GICS sector indexes) is information technology with an average gain of 7.3% [Figure 4]. This is interesting, as tech had lagged much of last year and earlier this year, before its big third quarter rally (+10.6%) on a strong second quarter earnings season. If tech can continue to lead, that could be a very healthy sign for equity markets in general, as this group has the largest weighting in the S&P 500.
WHAT COULD DRIVE THE FOURTH QUARTER?
Of course the biggest event for investors to consider in the fourth quarter is the U.S. presidential election. The next two debates are slated for October 9, 2016 and October 19, 2016, ahead of Election Day on November 8. Markets have expressed some preference for the decreased uncertainty of a Clinton presidency so far, although the race is close enough that markets may be volatile in October and early November.
Political risk is not limited to the United States. In addition to pre-Brexit planning in the United Kingdom over the next several months, the Italian constitutional referendum in late December has the potential to force a leadership change and hamper already lackluster economic growth in that country.
The upcoming Federal Reserve (Fed) policy meetings will also drive markets during the fourth quarter. We believe a rate hike may be unlikely just before the election at the November 2, 2016 Fed policy meeting. We see a hike as likely at the December 14, 2016 meeting, although it is possible that European banking fears, a policy mistake at home or abroad, a sharp deterioration in the U.S. economic data, a flare-up of China’s bad debt problem, etc. may provide cover for the Fed to hold off. Global central banks will also garner attention: the Bank of Japan meets onNovember 1, 2016 and December 20, 2016; the European Central Bank meets on December 8, 2016; and the Bank of England on December 14, 2016.
Finally, optimism is widespread ahead of the OPEC meeting on November 30, 2016, following the verbal commitment from members to agree to production cuts to help support prices. Odds favor a deal and we expect oil prices to potentially move higher in the intermediate term, although the risk that the deal falls apart could create a bump in the road.
CONCLUSION
The fourth quarter is historically strong for equities. Although we are looking for equities to end the year with mid-single-digit gains,* leaving them about where they are right now, the potential for more gains is always possible. A large sell-off during a fourth quarter that isn’t related to a recession is very rare; however, that does not mean stock market gains will come easily. As we continue to await the outcome of the U.S. presidential election and the key central bank meetings, we can expect continued volatility for the rest of the year.
Thanks to David Tonaszuck, CMT for contributing to this report.
*As noted in our Midyear Outlook 2016 publication, we believe the conditions are in place for a solid earnings rebound during the second half of 2016, due to the easing drags from the U.S. dollar and oil, coupled with minimal wage pressures. A slight increase in price-to-earnings ratios (PE) above 16.6 is possible as market participants gain greater clarity on the U.S. election and the U.K.’s relationship with Europe, and begin to price in earnings growth in 2017. Following several quarters of earnings declines, a turnaround in growth should support our forecast for mid-single-digit gains for stocks in 2016.
IMPORTANT DISCLOSURES
The opinions voiced in this material are for general information only and are not intended to provide specific advice or recommendations for any individual. To determine which investment(s) may be appropriate for you, consult your financial advisor prior to investing. All performance referenced is historical and is no guarantee of future results.
The economic forecasts set forth in the presentation may not develop as predicted and there can be no guarantee that strategies promoted will be successful.
Investing in stock includes numerous specific risks including: the fluctuation of dividend, loss of principal, and potential liquidity of the investment in a falling market.
All investing involves risk including loss of principal.
Because of its narrow focus, investing in a single sector, such as energy or manufacturing, will be subject to greater volatility than investing more broadly across many sectors and companies.
INDEX DESCRIPTIONS
The Standard & Poor’s 500 Index is a capitalization-weighted index of 500 stocks designed to measure performance of the broad domestic economy through changes in the aggregate market value of 500 stocks representing all major industries.
© LPL Financial