Milliman FRM Risk Matters: An Ounce of Prevention Is Worth a Pound of Cure
Learn more about this firmEQUITY MARKETS PULL BACK IN OCTOBER AS VOLATILITY REVERTS LOWER
The S&P 1500 notched its worst monthly return since January as investors looked ahead to the presidential election and the Fed’s last meeting in 2016.
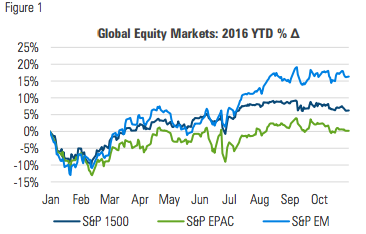
EM EQUITIES TALLIED THEIR FIFTH STRAIGHT MONTH OF POSITIVE RETURNS AS DEVELOPED MARKETS MOVED LOWER
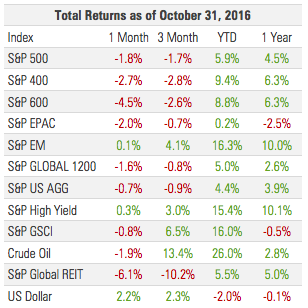
The S&P 1500 and S&P EPAC both declined by 2% in October. Up 13.7% since the end of May, EM equities are having their best year since 2009:
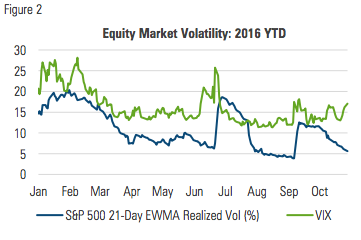
The decline in stocks was an orderly one, keeping realized volatility on a downward trend, even as implied volatility ticked higher:
MANAGED RISK PORTFOLIOS
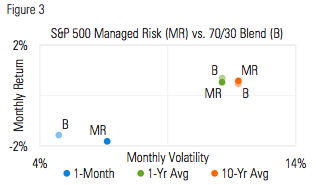
For the third consecutive month, amidst lower-than-average volatility, the S&P 500 Managed Risk Index (which has a 0% bond allocation and volatility target of 18%) maintained a 100% equity allocation throughout the entire month of October. After increasing more than 100% in September, S&P 500 volatility reverted lower in October.
The return of S&P 500 Managed Risk Index matched that of the S&P 500, and marginally trailed a 70/30 stock/bond blend:
As discussed in last month’s commentary, the market’s severest negative returns tend to be associated with its highest levels of volatility. Figure 4 depicts the relationship of the volatility of the S&P 500 with its corresponding returns, from 1928 - 2016:
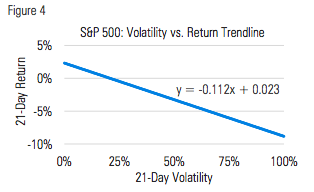
By seeking to participate less when markets exhibit higher volatility, a managed risk approach limits a portfolio’s exposure to the relationship between high volatility and negative returns. As with any trend line, however, there are points that fall on both sides of it, which means that in addition to avoiding severe negative returns, a managed risk approach can also miss out on some of the largest positive returns.
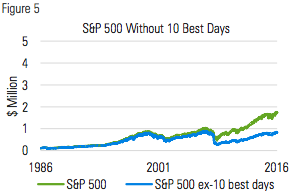
This of course raises the question of whether or not mitigating severe negative returns is worth sacrificing participation in the largest positive returns. After all, the effect of missing out on the market’s largest daily increases is substantial.
Over the last 30 years, from 1987 through October 31, 2016, the S&P 500 has generated an annualized total return of 10.0%. Removing its 10 best days from the time series reduces the return to 7.4%. Missing those days generates a cumulative return that is 51% less at the end of 30 years. In dollar terms, a starting investment of $100,000 earns $850,000 less:
As significant as that seems, the effect of missing the 10 worst days is even larger. Removing the 10 worst days from the time series results in a 13.6% annualized return, generating an additional 3.6% per year. That translates into an additional 167% over 30 years, or an additional $2.8 million on an initial $100,000 investment:
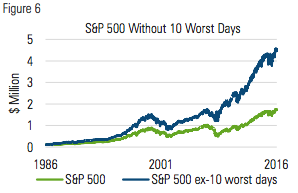
One clear takeaway from these charts is that mitigating the most severe negative returns has a bigger absolute effect than failing to capture the highest positive returns.
The reason behind this result is expressed in the adage often attributed to Benjamin Franklin: “An ounce of prevention is worth a pound of cure.” Put another way, the time and effort spent climbing out of a hole is greater than the time and effort it would have taken to avoid falling into it. In financial terms, a market decline of 50% requires a subsequent increase of 100% just to break even.
Figure 7 depicts the implications for the distribution of returns when the quartile of returns with the highest volatility is removed from the series. By reducing equity exposure when markets are volatile, a managed risk approach reduces its participation in both the positive and negative tail returns, thereby narrowing its return distribution:
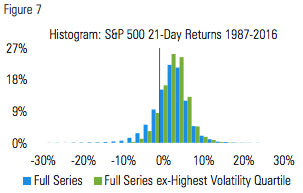
To borrow Franklin’s language, by taking preventative measures (i.e., reducing equity exposure when volatility is high) to diminish participation in market drawdowns, a managed risk approach reduces the need for post-drawdown cures. This type of risk/reward profile can appeal to investors of all stripes, but is especially pertinent to investors who rely on their assets for income and are sensitive to the market’s sequence of returns.
MARKET COMMENTARY
Of the 289 companies that reported earnings in October, 150 (53%) reported growth over the previous quarter and 224 (78%) surprised to the upside. Investors, however, weren’t overly impressed. The S&P 500 was lower out of the gate and never got into positive territory, finishing the month 1.8% lower.
After eight consecutive months of positive returns, small-cap stocks had their worst month since January, erasing one third of their year-to-date gains and giving up their YTD lead to mid-caps.
Perhaps spurred on by the prospect of post-election policy changes, October marked a record month for corporate deal making. With nearly half a trillion dollars in mergers and acquisitions announced globally, October toppled the previous record of $471 billion set in April 2007.
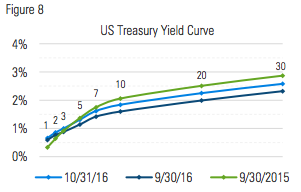
The U.S. yield curve shifted higher and steeper in October, likely reflecting growing expectations of a Fed rate hike in December. As of the end of October the market implied probability of a December meeting rate hike sat at its 2016 high of 71%, up from the 2016 low of 8% in June:
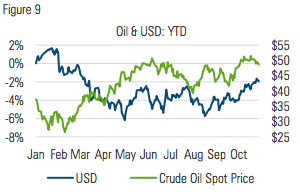
The price of oil climbed nearly 8% during the first three weeks of October before selling off sharply during the final week and finishing the month 2% lower. In spite of efforts to limit production, OPEC increased its output again in October, reaching an all-time high of 34 million barrels a day.
After declining during the first seven months of 2016, U.S. crude oil production has leveled off during the last three months around 8.5 million barrels per day. The price of crude is up 77% off its 14 year low in February 2016.
The U.S. dollar, as measured by the Bloomberg Dollar Spot Index, climbed 2.2% during the month, rising against the euro, yen and Canadian dollar.
THE SINKING INFLATION FOUNDATION
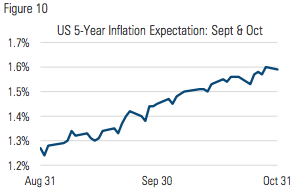
The yield on the 10-year Treasury bond increased 24 basis points in October to 1.84% and inflation expectations increased with it. Since the end of August, the 5-year breakeven rate has climbed 32 basis points, back to its 2016 high:
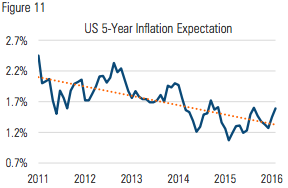
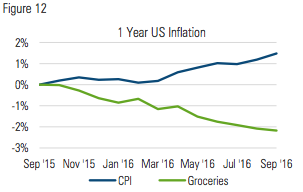
This naturally leaves investors wondering if inflation is indeed taking hold or if it’s merely a blip in the continuation of a wellestablished, years-long downward trend:
There is still positive inflation in the US, but it remains below the Fed target and there are pockets of significant deflation. Over the last year, the US consumer price index is 1.5% higher; within CPI, food and energy prices are down 2.2% and 2.8% respectively:
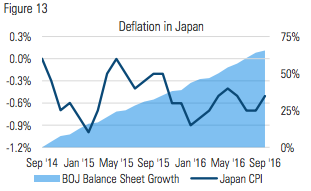
If Japan is any indication, US inflation may well be headed lower. Seeking to generate growth and inflation, the Bank of Japan has kept short term rates near or below 0 and made asset purchases over the last two years of ¥460 trillion ($4.5 trillion), increasing the size of its balance sheet 65%.
Remarkably, in spite of their efforts, consumer prices in Japan are lower today than they were two years ago:
In the US, Fed policy has been similar to BOJ policy and with similar results. The Fed appears ready to tighten in December, which, at the margin, will put downward pressure on inflation that is already tepid.
With the current bull market already seven years in the making and tighter policy arguably increasing the prospects of recession, investors will do well to remain vigilant in managing portfolio risk and protecting against the effects of drawdowns and volatility.

Milliman Financial Risk Management LLC is a global leader in financial risk management to the retirement savings industry. Milliman FRM provides investment advisory, hedging, and consulting services on over $166 billion in global assets (as of June 30, 2016).
Established in 1998, the practice includes professionals operating from three trading platforms around the world (Chicago, London, and Sydney).
Milliman is among the world's largest providers of actuarial and related products and services. The firm has consulting practices in healthcare, property & casualty insurance, life insurance and financial services, and employee benefits. Founded in 1947, Milliman is an independent firm with offices in major cities around the globe.
For further information:
MILLIMAN.COM/FRM
© Milliman Financial Risk Management


