Choose Your Own Misadventure
Happy New Year everyone! Part of our early January ritual is to read a number of market and economic projections for the upcoming year. And although they are interesting and (generally) thoughtful, to be frank, the articles are basically all the same. For 2017, the common themes are inflation and higher interest rates, lower taxes in the US, global growth (albeit minimal), a renewed interest in fiscal as compared to monetary policy, and political (or of late, tweet) risk.
The predictions above seem reasonable, but questions remain - how accurate will they be? And even if some turn out to be correct, what should we do about it? Regular readers of our musings know that we often discuss poor calls made by market pundits (e.g. Fed calling no contagion in 2007, the Greek Crisis, Brexit, and the recent US Election). Let’s just call it our guilty pleasure of denouncing the linear thinking used to generate opinions about dynamic and interconnected markets. But even when one follows only the most pragmatic analysts, forecasts often fall flat.
We do not write this to be the consummate contrarians or skeptics (roles quite revered in our business). It actually comes down to simple exponential mathematics and the innate human need for narrative. The Choose Your Own Adventure children’s books, popular in the late 1970s and 1980s, come to mind. These books put the reader in the role of the protagonist. Every couple of pages they face two or three options (e.g. if one way, flip to page 21, if another go to page 70), each of which leads to more options, ultimately generating one of many endings. Some of these books carried readers through 400+ distinct adventures. The narrative flexibility of these books generated enough enthusiasm to become best sellers. Kids were enthralled, demanding re-reads where only a slight deviation from the prior path created a completely different ending. This is where the parallel lies. The reason pundits are destined to get calls wrong is not because they are not well thought out, but because they present a linear story that has to get so many things right.
The path predicted through the Choose Your Own Adventure book of the economy and the markets has to be the path. They have to correctly: 1) identify an event, 2) call the timing, 3) call the result, 4) call the market reaction, 5) call the magnitude of the reaction, and finally, 6) call how long it takes to develop. Although not impossible, probably less likely than 50/50. We could elaborate with the miscalls of the most recent Presidential election or Brexit Vote where #1 and #2 were predetermined, but #3, #4, and #5 were missed by many, and #6 is still to be seen. For a better view, however, we step back to an event that played out five years ago where we can see all six: the downgrade of US government debt.
- Standard & Poor’s (S&P) downgraded US government debt from AAA to AA rating during a period of “fiscal cliff” brinksmanship that had many on edge.
- The ultimate news came down in August of 2011, although earlier in April of that year the S&P had put the US on credit watch negative.
- Markets were mixed regarding whether there would or would not be a downgrade.
- This is where the Choose Your Own Adventure story really took off, generating countless counterfactuals. Forecasts were broadly mixed. Many assuming a downgrade expected US Treasuries to sell off and the US dollar to weaken. The rationale was quite reasonable as the general rule of thumb is that bonds sell-off if downgraded. There were also concerns that money managers holding AAA paper by rule/covenant would be forced sellers of US Treasuries. Expectations were for risk assets to also sell off (equities, commodities, etc.) with the only safe havens being gold and the Japanese yen.
- The magnitudes of the calls varied so greatly that it is hard to pin down a consensus. Some called for an almost immediate recession, while others thought the markets would be marginally impacted.
- Calls on how long it would play out correlated highly with depth of reaction. Those calling for rising US interest rates and subsequently higher borrowing costs for the US Government saw reduced spending and potential for another recession. Others saw it as a blip, akin to Japan’s downgrade in 2002.
Let us say we give the benefit of the doubt to forecasters that called #1 and #2 (event and timing in 2011), it still leaves so many possible endings to the story that most still got at least part (if not all) wrong. Some turned out to be temporarily correct (yen rallied 5% post announcement, the S&P 500 Index sold down 6.5%, and gold jumped 7.8% in the first 5 days). Others were way off in direction and magnitude. The dollar actually rose against most currencies, and US Treasuries rallied (yield fell from 3.0% at end of July to below 2.0% by end of August). This brings up the last, but very important point of interval forecasting. Even if one were to make all of the correct assumptions in points 1 – 5 (which very few did), they also would have to get the interval of the development accurate. The S&P 500 did sell off as much as 8% post announcement through early October, only to rebound by 15% from the low in a matter of months. Over the same period gold jumped as high as 14%, only to sell off more than 17% from the peak.
All that said, it is easy to sit here and denounce the efforts of forecasters. In reality, to make sense of all of the economic, financial, behavioral, political, technical, and other variables of the world is yeoman’s work. Those who tirelessly implement pragmatic and dynamic approaches to forecasting should actually be commended. This is the paradox of the industry. Although many in our position do not like to think about it, strategic investors (like us) in liquid markets need the daily flurry generated by those tracking the calls of market tacticians and short-term forecasters. Imagine a market where everyone is strategic, agreeing to trading once every few years on a preset date. Now imagine that an unforeseen circumstance requires you to raise cash outside of that window. At what price can you sell? This is a dilemma of the private markets that public markets solve thanks to the day-to-day machinations of those calling interest rates and black swan events. Those calls generate trading activity. This activity creates liquidity which reduces the cost of investing for everyone. It is a symbiotic relationship. In a way, the tactical investor subsidizes the strategic investor by spending effort, time, and money to setting price and generating liquidity.
In that context, our job is to separate the headline news and forecasts that help create a functioning and liquid market from areas where the pricing mechanism may be at risk from a variety of factors. From a Choose Your Own Adventure book standpoint, it is not figuring out which of the 400+ outcomes is correct. Instead, it is realizing the limitations of the book and not getting caught up in just one story.
The Markets

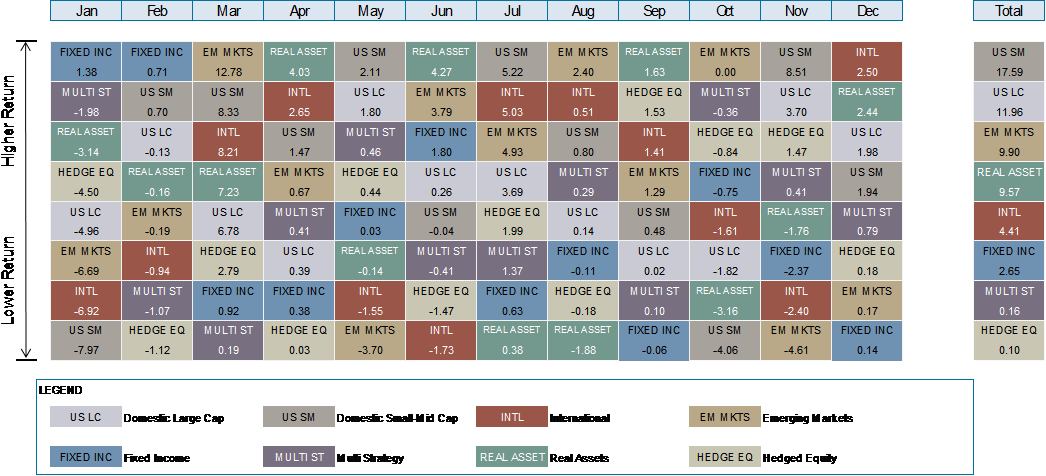
Source: eVestment, calendar year 2016
Whatever macro headlines that drove the markets before the US election took a back seat in November, with select risk assets (US banks, industrials, and energy) leading the charge into year end. Investors began to review the potential for material fiscal policy shifts surrounding corporate taxation, financial regulation, and infrastructure spending. The corresponding risk-on ebullience hurt bonds, with rates backing up in the US and abroad.
US large company stocks (represented by the S&P 500 Index) rose 3.8% for the quarter while US small-mid company stocks (represented by the Russell 2500 Index) rose 6.1%. International stocks (represented by the MSCI ACWI ex US IMI Index) fell 1.6%, while emerging market stocks (represented by the MSCI EM IMI Index) fell 4.5%. In emerging markets, much of the pain came from Trump targets Mexico and China (both down more than 7%), while Russian equities rallied 18.7% in US dollar terms.
At this time last year the Fed was calling for four interest rate hikes in 2016. Thanks to a multitude of factors, the US only got one. The latest December rate hike came with positive economic language that has markets discounting two to three rate hikes in 2017. The Barclays Capital US Aggregate Bond Index fell 3.0% for the quarter, most of that post-election. Muni bonds (which are not in the aforementioned Aggregate index) fell similarly. International fixed income markets were not spared. With US yields backing up, international sovereigns also sold off. The move cut the dollar value of international sovereigns trading with a negative yield from $12 trillion to $7.7 trillion by year end. The US dollar rose 7% in Q4, more than offsetting weakness from the first three quarters. Things looked better for more credit oriented areas of the market with high-yield bonds and bank loans rising more than 1.5% in Q4.
Alternative investment performance was again mixed in Q4. Multi-strategy funds (represented by the HFRI FoF Diversified Index) rose 0.8% for the quarter. Hedged equity managers (represented by the HFRX Equity Hedge Index) rose 0.8%, with value biased managers in the lead. REITs sold off more than 4% in Q4, thanks in part to the aforementioned global rate backup. Global Infrastructure also struggled despite a positive showing from US energy midstream. Commodities finished up almost 3% for the quarter, led by energy and industrial metals. Precious metals proved the weakest sector, as gold and silver fell 12.7% and 17.2%, respectively.
Some Thoughts
- “Those who have knowledge, don’t predict. Those who predict, don’t have knowledge.” -Lao Tzu
- “The only function of economic forecasting is to make astrology look respectable.” -John Naisbitt
- “We really can’t forecast all that well, and yet we pretend that we can, but we really can’t.” -Alan Greenspan
- “The herd instinct among forecasters makes sheep look like independent thinkers.” -Edgar Fiedler
- The S&P 500 Index was up for nine of the twelve months in 2016, with price change accounting for 80% of the gain and dividends accounting for the remaining 20%. (source: BTN Research).
- The “split” between up and down trading days in 2016 for the S&P 500 Index was 52% up, 48% down, which is pretty much the same ratio as the average has been for the last 50 years. (source: BTN Research).
- Although the S&P 500 Index was up roughly 12% in 2016, almost 30% of the stocks were down for the year. In addition, if you missed the three best days of the year, your gain fell to 4.4%. Although, if you missed the three worst days, your gain rose to 22.1%. (source: BTN Research).
- Income tax brackets are slightly changed for 2017, with the highest rate (39.6%) beginning at $418,400 for Single taxpayers and $470,700 for those filing Married Filing Jointly.
- Standard deduction amounts are $6,350 for Single taxpayers and $12,700 for those filing Married Filing Jointly.
- Itemized deductions begin to be limited by 3% of AGI over $261,500 for Single taxpayers and $313,800 for those filing Married Filing jointly.
- The estate and gift tax exemption amount for 2017 rises to $5,490,000, however the tax rate of 40% remains the same.
- 401(k) contribution limits stay unchanged at $18,000, but anyone age 50 or over can contribute an additional $6,000.
- Contribution limits for defined contribution plans go up to $54,000 (basically 20% of the income limit of $270,000).
- IRA and Roth IRA contribution limits remain at $5,500, but anyone age 50 or over can contribute an additional $1,000.
- We expect some level of tax reform in 2017-2018, so we will keep you posted.
_______________________
Certified Financial Planner Board of Standards, Inc. owns the certification marks CFP®, Certified Financial Planner™ and federally registered CFP (with flame design) in the U.S., which it awards to individuals who successfully complete CFP Board’s initial and ongoing certification requirements.
Bronfman E.L. Rothschild is a registered investment advisor. Securities, when offered, are offered through an affiliate, Bronfman E.L. Rothschild Capital, LLC (dba BELR Capital, LLC), member FINRA/SIPC.
This publication should not be viewed as a recommendation, an offer to sell, or a solicitation of an offer to buy a particular security or service. The commentary provided is for informational purposes only and should not be relied on for accounting, legal, tax, or investment advice. Financial information is from third-party sources. While such information is believed to be reliable, it is not verified or guaranteed. Performance of any indexes is provided for reference and competitive purposes only without factoring any fees, commissions, and other charges. Individual results achieved by investors will be different from those of the indexes. Indexes are unmanaged; one cannot invest directly into an index. The views and opinions expressed are those of Bronfman E.L. Rothschild, LP, and they are subject to change at any time. Past performance does not imply or guarantee future results. Investing in securities involves risks, including possible loss of principal. Diversification cannot assure a profit or guarantee against a loss. Investing involves other forms of risk that are not described here. For that reason, you should contact an investment professional before acting on any information in this publication.
© 2017 Bronfman E.L. Rothschild, LP
Read more commentaries by Bronfman E.L. Rothschild