Patience Pays
Spring is my favorite time of year here in Washington, DC. The weather begins to warm (bringing pleasant memories of spring and summer months long passed), plants and flowers return (especially the cherry blossoms), the grill is awakened from its winter hibernation, baseball begins, and Warren Buffet’s annual letter to Berkshire Hathaway shareholders arrives in the mail. Although this month’s commentary will not be a tribute to the “Oracle of Omaha,” and regardless of your affinity for Warren in general, his common-sense approach to investing provides learning opportunities for us all.
If you have read enough of his annual letters in the past, you know that Warren tends to repeat several important investing concepts (we all do tend to repeat things as we get older), from “keeping it simple,” to not following the herd, to his limited belief in forecasting (see our Q4 2016 commentary for our views on that topic), and perhaps most importantly, to having appropriate long-term holding periods and a great deal of patience. Some of my favorite quotes from Warren:
“Successful investing takes time, discipline and patience. No matter how great the talent or effort, some things just take time.”
“Calling someone who trades actively in the market an investor is like calling someone who repeatedly engages in one-night stands a romantic.”
“What we learn from history is that people do not learn from history.”
In today’s environment of Twitter, CNBC and other round-the-clock news/entertainment sources, the pace and complexity of investing has grown substantially. When those around you are picking the latest and greatest investments, churning portfolios in trying to predict where markets, or interest rates, or corporate earnings are headed next, human nature makes it difficult to stay disciplined. Even many professional investors will make unnecessary portfolio changes to justify their fees, follow the crowd, prove their intelligence or just show that they are doing something with client money.
Looking back in time (at the Dow Jones Industrial Average, which was first calculated in 1896), of the twenty best market days of all time, sixteen were during the Great Depression, one was a few days after the market crash of 1987, and two were during the 2008 financial crisis. Missing these days significantly reduced long-term returns, and most investors who missed them were those who sold out (and just as importantly, stopped buying) after stocks crashed and everyone around them panicked. History has shown that those who try to avoid losses consistently end up missing even larger gains.
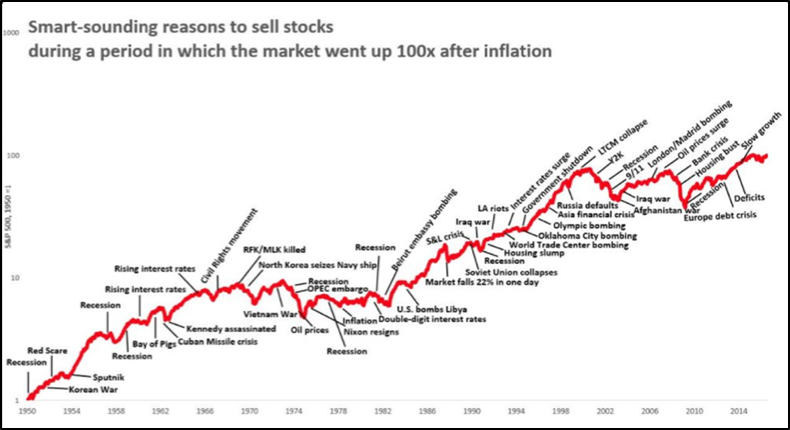
“Over the long term, the stock market news will be good. In the 20th century, the United States endured two world wars and other traumatic and expensive military conflicts; the Depression; a dozen or so recessions and financial panics; oil shocks; a fly epidemic; and the resignation of a disgraced president. Yet the Dow rose from 66 to 11,497.”
“This economic creation will deliver increasing wealth to our progeny far into the future. Yes, the build-up of wealth will be interrupted for short periods from time to time. It will not, however, be stopped. I’ll repeat what I’ve both said in the past and expect to say in future years: Babies born in America today are the luckiest crop in history.”
There will always be intelligent sounding reasons to consider selling out of the markets, or to be a bit pessimistic about the future.
 Source: Ritholtz.com
Even though the markets have continued to go up over time, those who respond to events negatively are judged as more intelligent than those who respond positively. While pessimism often sounds profound, optimism is often viewed as naïve or uninformed. While mostly bearish pundits like Jeremy Grantham, John Hussman or Nouriel Roubini are celebrated for their thought-provoking insight, Wharton Professor Jeremy Siegel is often ridiculed as a perma-stock-bull, blindly cheering for higher markets since the early 1980s (yet, since 1980, the S&P 500 Index has increased over twenty times over). However, it seems that few care about past results when someone is warning about The Next Great Depression.
Although the psychology behind this is beyond the scope of today’s musings, let’s just summarize it as being part of human evolution. Any being that treats threats more urgently than opportunities has a better chance for survival and reproduction.
“You do things when the opportunities come along. I’ve had periods in my life when I’ve had a bundle of ideas come along, and I’ve had long dry spells. If I get an idea next week, I’ll do something. If not, I won’t do a damn thing.”
One of the issues of being a bit pessimistic in investing is that it often requires action, whereas being more optimistic generally implies staying the course. Now, do not confuse discipline with disinterest, or that you should never make portfolio changes. This is not about doing nothing for the sake of doing nothing, but about doing nothing in those times when it will most likely help you avoid making a big mistake.
“You only have to do a very few things right in your life so long as you don't do too many things wrong."
“There needs to be a good reason for every move you make in your portfolio. Successful long-term investing is about learning to turn down many more investment ideas than you accept.”
The Markets
Source: Morningstar, Bloomberg
We begin another year with a reversal of trends past. Within the equity markets, growth beat value, large beat small, and low dividend yield beat high. The darlings of the post-election bump (financials and energy) were amongst the laggards in the first quarter, with similar patterns seen across several markets.
US large company stocks (represented by the S&P 500 Index) appreciated 6.1% for the quarter. US small-mid company stocks (represented by the Russell 2500 Index) rose 3.8%, giving back some of last year’s outperformance when small-mid stocks topped large 17.6% to 11.9%. International stocks (represented by the MSCI ACWI ex US IMI Index) bettered domestic with a near 8% rise in the quarter. Emerging market stocks (represented by the MSCI EM IMI Index) topped the totem pole with a 11.7% rise. As was the case with many areas, there was a clean reversal in EM in the first quarter. Mexico and China both topped 13% for the period, after lagging post the US elections. Conversely, Russian equities sold off approximately 5% after rallying nearly 19% in the fourth quarter of last year.
A second consecutive quarter with a rate hike brought little fanfare from US Bond investors. In fact, bonds have been quite resilient thus far in 2017. The Barclays Capital US Aggregate Bond Index rose 0.8% for the quarter, and is now up almost 1.5% since the December rate hike. The yield on the 10 Year Treasury topped out at 2.6% in mid-March, only to finish the quarter 25 bps lower. Muni bonds rose 1.6% for the quarter while International bonds also fared well thanks in part to a weakening US dollar. The more credit oriented areas of the market continued to perform well, with high-yield bonds rising 2.7% in the first quarter.
Alternative investment chugged along in the quarter with no major standouts. Multi-strategy funds (represented by the HFRI FoF Diversified Index) rose 1.5% for the quarter. Hedged equity managers (represented by the HFRX Equity Hedge Index) rose 2.7%. REITs in the US finished up 1%, but abroad they rose closer to 5%. Global Infrastructure led real assets topping 7% thanks to strong performance from toll roads and utilities. Commodities (-2.3%) were the laggard for the first quarter, thanks to a significant sell-off in energy (particularly natural gas -17.0%) and select agriculture components (soybeans -6.6%, sugar -13.9%). Solid performance from precious (e.g. gold +8.2%) and industrial metals (e.g. aluminum +15.4%), could not make up the difference.
Some Thoughts – The Cow Goes Moo, the Markets Go Meh…
There has been (and will continue to be) a small wave of new babies across our offices over the past year or so. To commemorate, we wanted to title this piece in the monosyllabic stylings typifying evening bedtime reading.
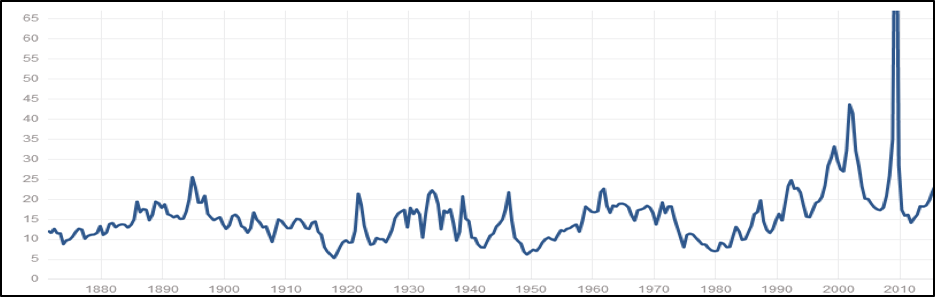
This section is normally reserved for a few fun bullet points, but we wanted to add a little color on the current “meh” state of the traditional financial markets. Before we get to the market “meh” however, (which echoes our thoughts over the past few years of lower return expectations going forward) a note on charts and stories. Over the past few years we have seen more and more charts discussing valuations going back 100+ years with subsequent prognostications for the future. To head these off at the pass (and before we get too engrossed in the accompanying stories) we start with several requirements. One of the most important of which is context. This brings us to the ever-popular S&P 500 P/E valuation chart (example below) going back to 1880.
Source: Robert Shiller
In looking at this (and this alone), one sees that valuations didn’t rise above 25x P/E until the tech bubble of 20 years ago. One can run averages of that past to yield P/Es around 15x-16x; delineating that as the appropriate level.
But a lot has changed over the past 100 years. If you were to look at the S&P (or the backtested version of the S&P, since the original S&P 500 was introduced in 1957) to the turn of the century, it was heavily weighted to railroad stocks. In fact, it did not become the dynamic market cap weighted benchmark that we know today until 1988. Prior to that it went through several iterations, none of which look like the market as it is today:
- In 1957 it was 85% industrials, 10% utilities, 5% railroads.
- In 1976 they added financials – 86% industrials, 6.5% utilities, 6.1 financials, 1.6% transportation (added air, freight and trucking to rail). The index moved to a hard 400 industrials, 40 utilities, 40 financials, 20 transport
- In 1988 the 400-40-40-20 model was finally replaced by the market cap weighting we use today.
This chart also provides no color on changes in accounting rules, regulatory (e.g. retirement plans allowed to own equity funds in the 1980s), taxation (e.g. dividends) and liquidity. It misses the fact that the number of publically traded stocks in the US has fallen 50% since 1996. It even misses out on the inflation and interest rate environment at the time. In 1981 inflation was in the double digits, and US Investment Grade Corporate bonds yielded (yield to worst) more than 16%. At the same time stocks traded at below a 9x P/E multiple. That makes contextual sense, since investors would require a large P/E discount to select risky stocks over safer bonds at those yield levels. In short, context matters.
With grain of salt firmly in place, markets today (both domestically and overseas) standout for their lack of standouts. US equities are not cheap by almost any metric (e.g. price/earnings, price/cash flows, price/sales, earnings yield/cost of debt, etc.) although they are also not as overpriced as they were approaching the tech bubble. International equities, although slightly less so, offer a similar dilemma, with no obvious pockets of cheapness. This translates to lower expected returns ahead, unless companies find a way to generate double digit earnings growth for the foreseeable future.
The bond markets are similarly situated. It would be nice to say that investors can earn outsized returns in select areas of the fixed income markets today, but spread compression reflects a reality where coupon clipping may be the best one can do for some time. As an example, investment grade corporate bonds currently yield around 1.2% above that of similar treasuries (the industry calls this the Option Adjusted Spread (OAS)). Although that number has been as low as 0.5% in the late 1990s, the typical range is 1%-2%, leaving little in the way of spread compression upside today. Similarly, with higher yielding bonds (junk rated), the current OAS is approximately 3.9%. The historical range there is 3%-7%. Other fixed income areas offer similar spread dynamics. For bond holders, the biggest issues have not changed –direction of interest rates (specifically shape of yield curve), default dynamics, technical (supply/demand) and liquidity. We are monitoring those dynamics closely for signs of deterioration, but for now, we are happy to clip the coupon.
Certified Financial Planner Board of Standards, Inc. owns the certification marks CFP®, Certified Financial Planner™ and federally registered CFP (with flame design) in the U.S., which it awards to individuals who successfully complete CFP Board’s initial and ongoing certification requirements.
Bronfman E.L. Rothschild is a registered investment advisor. Securities, when offered, are offered through an affiliate, Bronfman E.L. Rothschild Capital, LLC (dba BELR Capital, LLC), member FINRA/SIPC.
This publication should not be viewed as a recommendation, an offer to sell, or a solicitation of an offer to buy a particular security or service. The commentary provided is for informational purposes only and should not be relied on for accounting, legal, tax, or investment advice. Financial information is from third-party sources. While such information is believed to be reliable, it is not verified or guaranteed. Performance of any indexes is provided for reference and competitive purposes only without factoring any fees, commissions, and other charges. Individual results achieved by investors will be different from those of the indexes. Indexes are unmanaged; one cannot invest directly into an index. The views and opinions expressed are those of Bronfman E.L. Rothschild, LP, and they are subject to change at any time. Past performance does not imply or guarantee future results. Investing in securities involves risks, including possible loss of principal. Diversification cannot assure a profit or guarantee against a loss. Investing involves other forms of risk that are not described here. For that reason, you should contact an investment professional before acting on any information in this publication.
© 2017 Bronfman E.L. Rothschild, LP
Read more commentaries by Bronfman E.L. Rothschild
 Source: Ritholtz.com
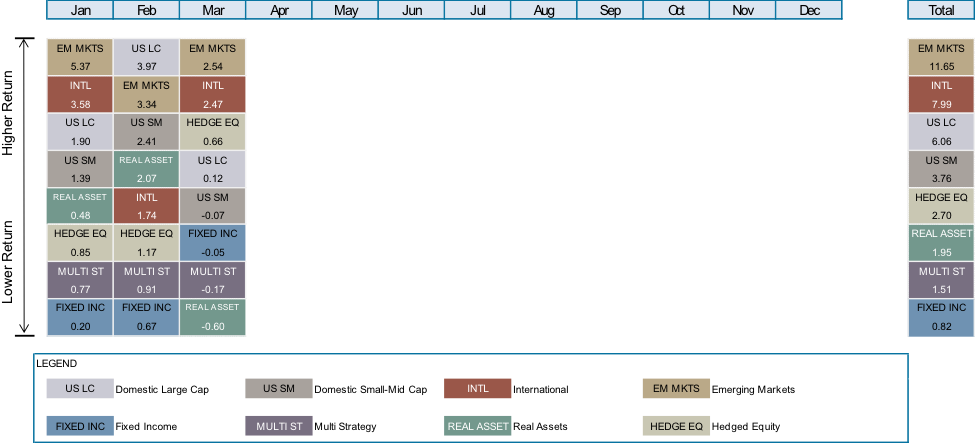
 Source: Robert Shiller