In this issue:
- New market highs are a regular occurrence of late. Are they actually newsworthy?
- Lower correlations are contributing to lower global equity volatility.
- A flattening yield curve may offer the Fed more flexibility with the pace of future rate hikes.
- Fed tightening is being offset by accommodation from other banks.
- The value of US stocks and bonds relative to GDP sits at a 20 year high.
AFTER PAUSING IN MARCH, US EQUITY MARKETS RESUMED THEIR ASCENT
After stumbling out of the gate, a 2.5% rally in the second half of April left the broad-market S&P 1500 1% higher on the month.
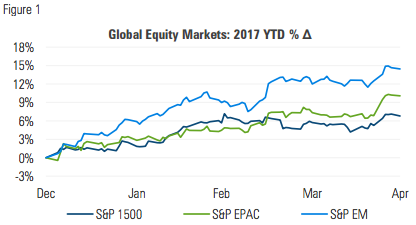
EX-US STOCKS LED THE WAY AS THE GLOBAL EQUITY MARKET CHURNED HIGHER AMID ONGOING LOW VOLATILITY
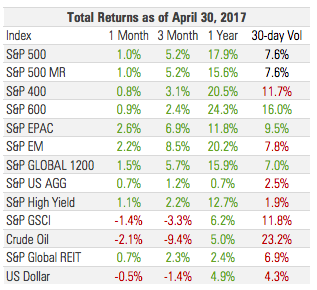
The S&P Global Ex-US Broad Market Index notched its fifth consecutive monthly return of >1.5%, as all three broad market segments finished April firmly higher:
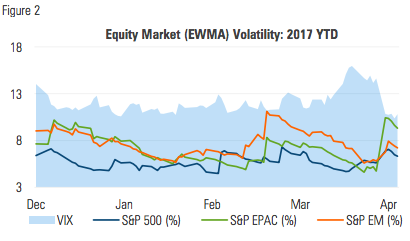
Volatility made a gentle descent through most of the month before reversing course and climbing during the final week. Even after hitting its year-to-date high, EPAC volatility remains historically low:
MANAGED RISK PORTFOLIOS
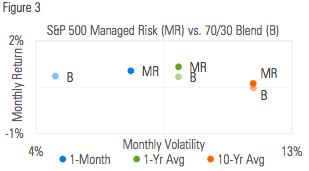
US equity market volatility finished higher for the second month in a row, but remained well below the threshold of the S&P 500 Managed Risk Index (which has a 0% bond allocation and volatility target of 18%). The index has now maintained a 100% equity allocation for the entirety of its ninth consecutive calendar month.
The return and volatility of S&P 500 Managed Risk Index in March matched those of the S&P 500, and surpassed the return of a 70/30 blend by 18 bps.
Over the last 10 years, the average monthly return of the Managed Risk Index has exceeded the average monthly return of a 70/30 blend by 15 bps. That translates into an average annualized excess return of 1.09% over a 70/30 blend; it generated this return with volatility that was 200 bps lower and half the drawdown.
Much is often made of the market touching new highs, which has happened frequently of late. Prior to the financial crisis, the S&P 500 touched its all-time high of 1565 on October 9, 2007, from which it fell 57% over the next 17 months. After touching its crisis-low in March 2009, it took another four years to close above its pre-crisis peak on March 28, 2013:
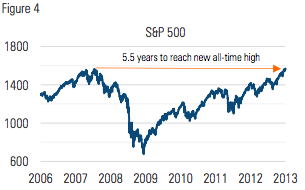
Since then, the S&P 500, along with other benchmarking counterparts, has gone on to make new highs each consecutive year. In 2017 alone, the NASDAQ 100 Index has reached 31 new all-time high closing prices (more than one every three trading days). Each time it happens the media are quick to report on it, generally either from a perspective of doom and gloom or extreme optimism.
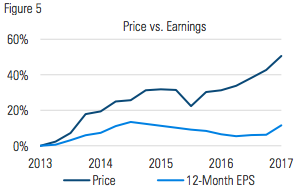
A new high might make for a good news story, but in reality the market’s nominal price level is of little significance without knowledge of the thing being priced. The stock market is essentially a place where investors can exchange cash for future earnings or future earnings for cash. So it isn’t the price level itself that matters, but rather what the price level says about how much investors are willing to pay for earnings.
Since the time of its 2013 recovery to its pre-crisis peak, the price of the S&P 500 is 51% higher, while its earnings have risen by just 12%. Investors’ willingness to pay more for earnings has pushed valuations as high as they’ve been in some time.
A managed risk approach is generally agnostic toward valuations. As markets have climbed in recent months amidst historically low volatility, managed risk strategies have generally employed their maximum respective equity allocations and have enjoyed strong participation. All the while they’ve been running and implementing their models, monitoring and analyzing volatility and maintaining their capital preservation positions.
If investors decide one day that valuations are too high and volatility ensues, a managed risk approach stands at the ready to seek to mitigate that risk.
MARKET COMMENTARY
The global equity market notched its sixth consecutive positive monthly return and 12th out of the last 14. Developed and emerging markets once again led the way; the S&P Global ex- US Index has now produced an average monthly return of 2.5% over the last five months, its best risk-adjusted monthly return since early 2013.
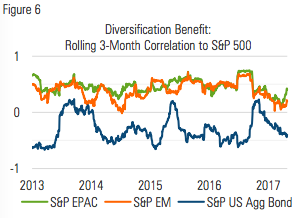
n addition to the relatively low volatility of the individual market segments, their correlations have been hovering in the lower end of their longer-term range. Given lower correlation combined with the already low volatility of the individual segments, it’s no surprise the three-month volatility of the S&P Global 1200 Index touched a new 10-year low in April:
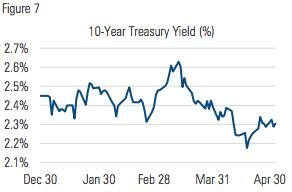
The yield on the 10-year Treasury dipped below 2.20% in midApril touching its lowest point since the first half of November:
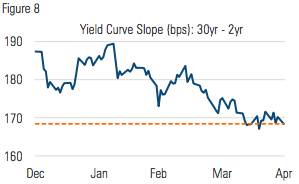
Longer-term rates have edged lower in 2017 while shorter-term rates have crept higher causing the yield curve to flatten by nearly 20 basis points year to date. All else equal, a flatter yield curve puts downward pressure on loan growth and can give the Fed greater flexibility as it moves toward less accommodative policy:
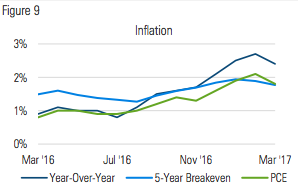
After increasing for several consecutive months, indicators of inflation cooled in March. Personal consumption expenditures (PCE) dropped back below 2%, giving the Fed reason to reassess its fed funds projections for the remainder of the year:
TIGHTER FED OFFSET BY LOOSER WORLD
Last month’s commentary discussed the Fed’s potential challenge in using a higher fed funds rate to slow loan growth while holding more than $2 trillion in excess reserves. The Fed has begun to publicly address the notion of shrinking their balance sheet, but has yet to take any action.
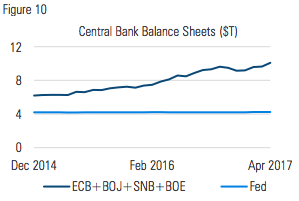
The Fed grew its balance sheet through three phases of quantitative easing (QE), the last of which ended in December 2014 after QE3 purchases were tapered down to zero.
Since that time, the Fed’s balance sheet has been stable as proceeds from maturing bonds have been reinvested. This, however, has not prevented other of the world’s major central banks from continuing to buy assets. Since the end of December 2014 when the Fed stopped its balance sheet expansion, the central banks of Europe, Japan, Switzerland and England have grown their balance sheets in aggregate by 65%. In 2017 alone these banks have added $1 trillion, bringing their combined total to $10.3 trillion. Include the Fed in that and the number climbs to $14.5 trillion.
Data from the IMF indicate that the combined GDP’s of the countries associated with these central banks is approximately $39 trillion. This means central banks are holding combined assets worth more than a third of their combined GDP.
From one perspective this may not seem problematic; an individual who has accumulated assets worth three times his annual income level would likely be commended for his prudent consumption and good investing. The difference lies in the fact that the banks have financed their asset purchases not through earnings, but rather merely through creation of bank reserves.
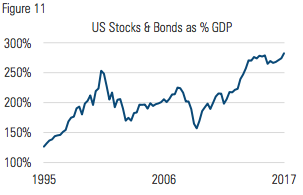
Figure 11 shows the combined value of US stocks and bonds (represented by the market cap of the Russell 1000 Index and face value of the BofA ML US Corporate, Government & Mortgage Index) as a percentage of US GDP.
As of the end of March, the total value represented in these two indices stood at $46 trillion, an amount equal to approximately 280% of US GDP:
It would be difficult to argue that the ratio would be at this level today in the absence of central bank activity, which raises the question of how it will react when the central banks cease their activity. Equally pressing is what will happen if they don’t?
If nothing else, this perhaps highlights how little the Fed has done to date to normalize policy, how skewed the US economy still is relative to historical levels, and how far there is to go to revert to something closer to normal.
After so many years of market gains, it can be easy to grow complacent and lose sight of the conditions bubbling under the surface. In times such as these we believe that ongoing, vigilant risk management remains as important as ever.

Milliman Financial Risk Management LLC is a global leader in financial risk management to the retirement savings industry. Milliman FRM provides investment advisory, hedging, and consulting services on over $143 billion in global assets (as of December 31, 2016).
Established in 1998, the practice includes professionals operating from three trading platforms around the world (Chicago, London, and Sydney).
Milliman is among the world's largest providers of actuarial and related products and services. The firm has consulting practices in healthcare, property & casualty insurance, life insurance and financial services, and employee benefits. Founded in 1947, Milliman is an independent firm with offices in major cities around the globe.
For further information:
MILLIMAN.COM/FRM
Recipients must make their own independent decisions regarding any strategies or securities or financial instruments mentioned herein.The products or services described or referenced herein may not be suitable or appropriate for the recipient. Many of the products and services described or referenced herein involve significant risks, and the recipient should not make any decision or enter into any transaction unless the recipient has fully understood all such risks and has independently determined that such decisions or transactions are appropriate for the recipient.
Any discussion of risks contained herein with respect to any product or service should not be considered a disclosure of all risks or a complete discussion of the risks involved.
The recipient should not construe any of the material contained herein as investment, hedging, trading, legal, regulatory, tax, accounting or other advice. The recipient should not act on any information in this document without consulting its investment, hedging, trading, legal, regulatory, tax, accounting and other advisors.
The materials in this document represent the opinion of the authors and are not representative of the views of Milliman, Inc. Milliman does not certify the information, nor does it guarantee the accuracy and completeness of such information. Use of such information is voluntary and should not be relied upon unless an independent review of its accuracy and completeness has been performed. Materials may not be reproduced without the express consent of Milliman.
MIL_COM_1 4/17_4/18 © 2017 Milliman Financial Risk Management LLC


