Dear Fellow Investors,
We thought it would be very helpful to review Warren Buffett’s argument in 19991, the last time there was very high expectations attached to technology stocks and to the overall level of common stock prices. We will reference Buffett’s quotes by the year he said them. The sections labeled 2017 offer our current observations on the markets and thoughts from respected experts.
Buffett in 1999 “Investors in stocks these days are expecting far too much, and I'm going to explain why. That will inevitably set me to talking about the general stock market, a subject I'm usually unwilling to discuss. But I want to make one thing clear going in: Though I will be talking about the level of the market, I will not be predicting its next moves. At Berkshire (BRK.B), we focus almost exclusively on the valuations of individual companies. The fact is that markets behave in ways, sometimes for a very long stretch, that are not linked to value. Sooner or later, though, value counts.”
2017 Like Buffett, we recognize that we have no ability to predict market swings and we stick to our “circle of competence.” Buffett recently emphasized on CNBC that if interest rates stay low, investors aren't expecting enough from stocks. Dan Fuss, a 57-year veteran of the bond market and manager of the Loomis Sayles Bond Fund says, "We are keeping our maturities short for the coming normalizing of interest rates." We find it interesting that Buffett has talked more about one side of the interest rate movement coin rather than the more dangerous rising interest rate side.
Buffett in 1999 “Let's start by defining "investing." The definition is simple but often forgotten: Investing is laying out money now to get more money back in the future--more money in real terms, after taking inflation into account.
Now, to get some historical perspective, let's look back at the 34 years before this one--and here we are going to see an almost Biblical kind of symmetry, in the sense of lean years and fat years--to observe what happened in the stock market. Take, to begin with, the first 17 years of the period, from the end of 1964 through 1981. Here's what took place in that interval:
- DOW JONES INDUSTRIAL AVERAGE Dec. 31, 1964: 874.12 Dec. 31, 1981: 875.00
Now I'm known as a long-term investor and a patient guy, but that is not my idea of a big move.
To understand why that happened, we need first to look at one of the two important variables that affect investment results: interest rates. These act on financial valuations the way gravity acts on matter: The higher the rate, the greater the downward pull. That's because the rates of return that investors need from any kind of investment are directly tied to the risk-free rate that they can earn from government securities. So, if the government rate rises, the prices of all other investments must adjust downward, to a level that brings their expected rates in line.
The increase in equity values since 1981 beats anything you can find in history. This increase even surpasses what you would have realized if you'd bought stocks in 1932, at their Depression bottom--on its lowest day, July 8, 1932, the Dow closed at 41.22--and held them for 17 years.”
2017 We look at ten-year Treasury Bonds with a 2.23% interest rate and stocks trading at high historical levels in relation to earnings, book value and gross domestic product (GDP) wondering if the same case can be made for the next 17 years.
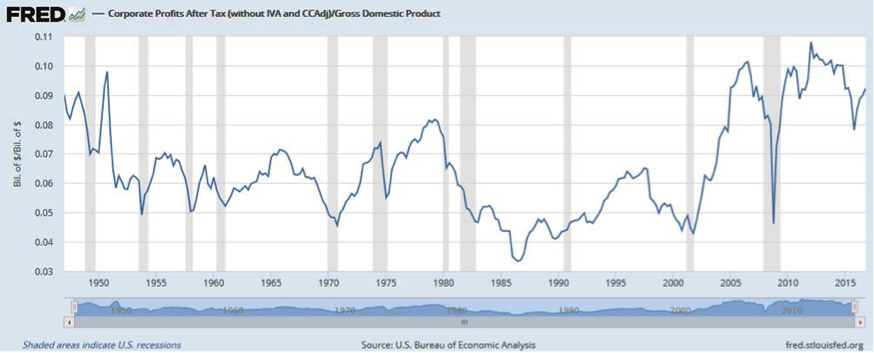
Buffett in 1999 “The second thing bearing on stock prices during this 17 years was after-tax corporate profits, which this chart [we have updated below2] displays as a percentage of GDP. In effect, what this chart tells you is what portion of the GDP ended up every year with the shareholders of American business.

Corporate profits as a percentage of GDP peaked in 1929, and then they tanked…But from 1951 on, the percentage settled down pretty much to a 4% to 6.5% range.
By 1981, though, the trend was headed toward the bottom of that band, and in 1982 profits tumbled to 3.5%. So, at that point investors were looking at two strong negatives: Profits were sub-par and interest rates were sky-high.
And as is so typical, investors projected out into the future what they were seeing. That's their unshakable habit: looking into the rear-view mirror instead of through the windshield.”
2017 Corporate profits have gone through the roof (see chart above). The chart shows that profits were nearly 10% at the last secular low for interest rates in 1952. It also appears to us that technology companies which dominate a particular sector of modern life (social media, search, online commerce) are allowed to leverage their dominance in their main business to attack industries and companies without the same proprietary information or clout. More importantly they have caught the investing public’s imagination.
Technology companies are drastically reducing the need for labor in many industries and are causing capital to win at labor’s expense. It looks to us like the Federal Trade Commission (FTC) and the Anti-Trust Enforcement division of the US Department of Justice have taken an eight-year sabbatical on most cases associated with tech stock darlings. Teddy Roosevelt is rolling in his grave as Alphabet (GOOGL) becomes Standard Oil, Facebook (FB) becomes AT&T (T) and Amazon (AMZN) becomes the railroads with an overwhelming control over life and business in the US.
Buffett in 1999 “Today (1999), if an investor is to achieve juicy profits in the market over ten years or 17 or 20, one or more of three things must happen. I'll delay talking about the last of them for a bit, but here are the first two:
(1) Interest rates must fall further. If government interest rates, now at a level of about 6%, were to fall to 3%, that factor alone would come close to doubling the value of common stocks. Incidentally, if you think interest rates are going to do that--or fall to the 1% that Japan has experienced--you should head for where you can really make a bundle: bond options.”
2017 Buffett was correct and the move to 2% on Treasury bond rates did come close to doubling the Dow Jones Industrial Average. Are we going to 1% long-term interest rates over the next 17 years or is this as good as it gets?
Buffett in 1999
(2) “Corporate profitability in relation to GDP must rise. You know, someone once told me that New York has more lawyers than people. I think that's the same fellow who thinks profits will become larger than GDP. When you begin to expect the growth of a component factor to forever outpace that of the aggregate, you get into certain mathematical problems. In my opinion, you have to be wildly optimistic to believe that corporate profits as a percent of GDP can, for any sustained period, hold much above 6%. One thing keeping the percentage down will be competition, which is alive and well.”
2017 Corporate profits rose substantially since 1999 and rewarded long-duration common stock owners in concert with lower interest rates (quite a rearview mirror). Wise investors like Jeremy Grantham have had to wrestle recently with thoughts that a “permanently higher level” of corporate profitability in relation to the overall GDP might exist (It’s different this time).
Buffett mentioned that competition would keep profits down in 1999, but he had no idea that companies the likes of Facebook, Google and Amazon would be allowed to gain national importance the way Standard Oil, AT&T and the railroads did in 1900. Imagine if his Mid-American Energy business was not regulated.
Buffett in 1999 “So where do some reasonable assumptions lead us? Let's say that GDP grows at an average 5% a year--3% real growth, which is pretty darn good, plus 2% inflation. If GDP grows at 5%, and you don't have some help from interest rates, the aggregate value of equities is not going to grow a whole lot more. Nor can investors expect to score because companies are busy boosting their per-share earnings by buying in their stock. The offset here is that the companies are just about as busy issuing new stock, both through primary offerings and those ever-present stock options.”
2017 To us, Buffett's warning is as valid or more valid today than in 1999 before the tech crash! The dilution of existing shareholders at major companies by issuance of stock options and restricted shares should have the same impact on today’s glam tech companies that it did on Microsoft (MSFT), Intel (INTC) and Cisco (CSCO) in the late 1990’s. It took 16 years for MSFT to get even with its 2000 high share price, while Intel and Cisco are still far below where they traded in early 2000. Back in 1999, there seemed to be no limit to what the most popular tech companies could accomplish and today, it is safe to say there are no limits being put on the FANG stocks.3
Buffett in 1999 “Bear in mind--this is a critical fact often ignored--that investors as a whole cannot get anything out of their businesses except what the businesses earn. Sure, you and I can sell each other stocks at higher and higher prices. You personally might outsmart the next fellow by buying low and selling high. The absolute most that the owners of a business, in aggregate, can get out of it in the end--between now and Judgment Day--is what that business earns over time.”
2017 Buffett has been spending a great deal of time praising Jeff Bezos and Amazon who have created astounding returns in the stock market while losing money selling millions of items. It appears that Amazon has become rich by "outsmarting the other fellows." The sum of all reported profits of Amazon in 20 years might add up to $5 billion. Would Buffett pay around $1,000 per share (as of May 30, 2017) for Amazon to start with an $8 per share profit in calendar 2017 (Value Line estimate)?
In his book, A Short History of Financial Euphoria, John Kenneth Galbraith wrote the following, “A further rule is that when a mood of excitement pervades a market or surrounds an investment prospect, when there is a claim of unique opportunity based on special foresight, all sensible people should circle the wagons; it is time for caution.”
Seattle Uber drivers and Joe Kennedy's shoeshine boy are on the same page!
Buffett in 1999 “Let me summarize what I've been saying about the stock market: I think it's very hard to come up with a persuasive case that equities will over the next 17 years perform anything like--anything like--they've performed in the past 17. If I had to pick the most probable return, from appreciation and dividends combined, that investors in aggregate--repeat, aggregate--would earn in a world of constant interest rates, 2% inflation, and those ever-hurtful frictional costs, it would be 6%. If you strip out the inflation component from this nominal return (which you would need to do however inflation fluctuates), that's 4% in real terms. And if 4% is wrong, I believe that the percentage is just as likely to be less as more.”
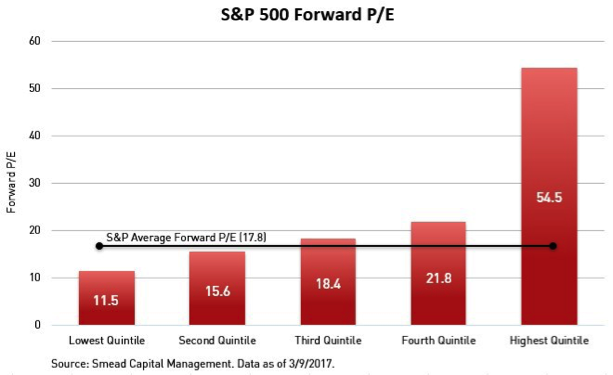
2017 The argument is better for low returns today because the dividend rate is lower, interest rates are lower, the corporate profits margins are higher and the S&P 500 is over-weighted again in high price-to-earnings (P/E) ratio stocks. Also, expensive stocks are the most disconnected to the average stock as they've been since 1999.
Expensive stocks extremely expensive
Buffett in 1999 “And there's still another major qualification to be considered. If you and I were trading pieces of our business in this room, we could escape transactional costs because there would be no brokers around to take a bite out of every trade we made. But in the real-world investors have a habit of wanting to change chairs, or of at least getting advice as to whether they should, and that costs money--big money.
And what do they come to? My estimate is that investors in American stocks pay out well over $100 billion a year--say, $130 billion--to move around on those chairs or to buy advice as to whether they should!”
2017 At Smead Capital Management, we seek to hold companies for a long time, significantly reducing the frictional costs Buffett is referring to. Now that stocks are at elevated levels compared to history (as they were in 1999) and tech stocks make up nearly 25% of the index if you include Amazon and Netflix as tech stocks. Buffett is solving the expense problem by heaping praise on the S&P 500 Index and its wholesaler in chief, Jack Bogle. In case you are wondering, index funds were already up and running in 1999.
Together, Bogle and Buffett have created a virtuous circle in tech stocks. Buffett now praises tech stocks, apologizes for not owning them and they go up. The S&P 500 goes up because tech stocks are outperforming. Money pours into the S&P 500 which has the effect of driving up tech stocks in a new virtuous circle. Ironically, long-term historical data shows that the companies with the fastest earnings growth underperform the companies with the worst results over one-year time periods!
Buffett in 1999 “I won't dwell on other glamorous businesses that dramatically changed our lives but concurrently failed to deliver rewards to US investors: the manufacture of radios and televisions, for example. But I will draw a lesson from these businesses: The key to investing is not assessing how much an industry is going to affect society, or how much it will grow, but rather determining the competitive advantage of any given company and, above all, the durability of that advantage.”
2017 Standard Oil, AT&T and the railroads had very wide moats before they were broken up or regulated. It is not just us that seem to recognize the risks to the US economy and to the share prices of the most popular technology stocks. Many of the leading business news organizations have recently written about either breaking up or regulating one or more of the FANG stocks. Our favorite writer on the subject is Farhad Manjoo from The New York Times who has dubbed the FANG stocks the “frightful five”. Our question is, are Senator Elizabeth Warren and Senator Chuck Schumer listening?
Buffett in 2006 “Once a price history develops, and people hear that their neighbor made a lot of money on something, that impulse takes over, and we're seeing that in commodities and housing...Orgies tend to be wildest toward the end. It's like being Cinderella at the ball. You know that at midnight everything's going to turn back to pumpkins & mice.”4
2017 At Smead Capital Management, we are very grateful for the wisdom and kind education Buffett has extended to us and other investors. However, even Buffett makes mistakes occasionally. Buffett called Coke and Gillette the "Inevitables" in the late 1990's when he should have sold his holdings. He amassed a position in ConocoPhillips between February of 2006 and the summer of 2008 near the 20-year high in oil prices. He travelled to China in September of 2010 at the height of the China, emerging market and commodity hype. He and Munger heaped praise on the guy running BYD when they should have been selling every share. Now, he has entered the FANG-stock orgy, a lot closer to midnight than to 4 o’clock pm, while the S&P 500 Index is at a juncture with lower interest rates and higher profit margins than his warning speech in 1999.
We have already “rounded up the wagons” concerning the rabid mania in glamour tech stocks. As contrarians, we relish expecting higher interest rates and a better economy, which moves the economic spoils away from technology stocks toward household formation, child bearing and more useful endeavors which come with them! Someday in the future, when the great tech companies have stumbled and the crowd is long gone, we will go shopping among those which survive and prosper.
Warm Regards, William Smead
1http://archive.fortune.com/magazines/fortune/fortune_archive/1999/11/22/269071/index.htm
2Source: FRED and the US Bureau of Economic Analysis
3FANG stocks include Facebook, Amazon, Netflix and Alphabet.
4http://money.cnn.com/2006/05/05/news/newsmakers/buffett_050606/index.htm?section=money_latest
The information contained in this missive represents Smead Capital Management's opinions, and should not be construed as personalized or individualized investment advice and are subject to change. Past performance is no guarantee of future results. Bill Smead, CIO and CEO, wrote this article. It should not be assumed that investing in any securities mentioned above will or will not be profitable. Portfolio composition is subject to change at any time and references to specific securities, industries and sectors in this letter are not recommendations to purchase or sell any particular security. Current and future portfolio holdings are subject to risk. In preparing this document, SCM has relied upon and assumed, without independent verification, the accuracy and completeness of all information available from public sources. A list of all recommendations made by Smead Capital Management within the past twelve-month period is available upon request.
This Missive and others are available at www.smeadcap.com
© Smead Capital Management
Read more commentaries by Smead Capital Management