Notwithstanding High Valuations, Global Equities Pushed Higher In May
Learn more about this firmMembership required
Membership is now required to use this feature. To learn more:
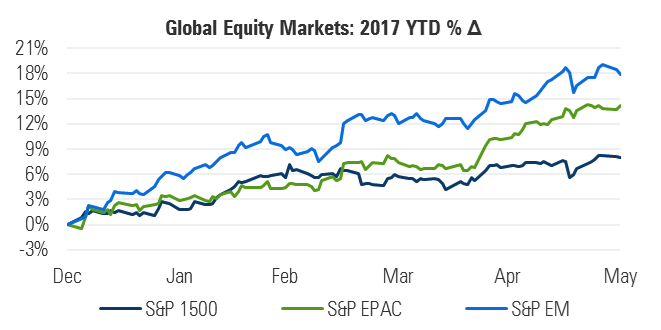
View Membership BenefitsSPURRED ON BY A WEAKER DOLLAR, GLOBAL EX-US EQUITIES EXTENDED THEIR YTD LEAD OVER US EQUITIES, LED BY EMERGING MARKETS
Over the past seven years, the average YTD return for emerging market stocks through the end of May was 1%. In 2017, they are up 18%, their best since 2009:
Figure 1
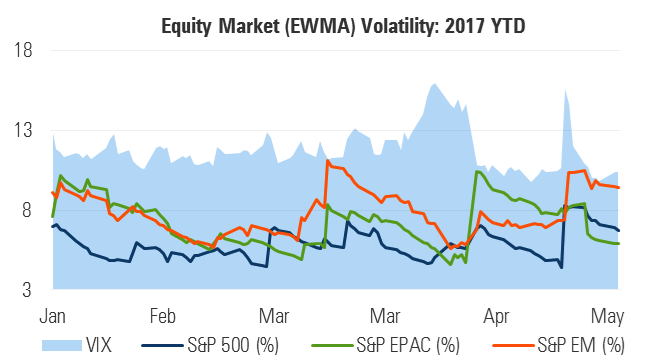
Implied volatility briefly spiked again for the second straight month while realized volatility continued to hover at historically low levels:
Figure 2
MANAGED RISK PORTFOLIOS
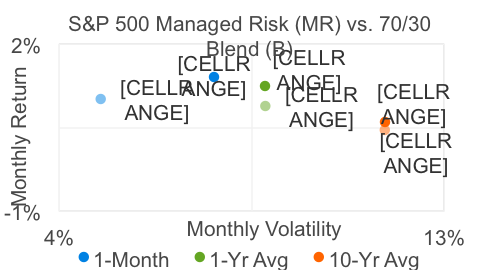
After increasing by 30% mid-month, US equity market volatility reverted lower, finishing the month essentially where it began and below the threshold of the S&P 500 Managed Risk Index (which has a 0% bond allocation and volatility target of 18%). The index has now maintained a 100% equity allocation for the entirety of its tenth consecutive calendar month.
The return and volatility of S&P 500 Managed Risk Index in May matched those of the S&P 500, and surpassed the return of a 70/30 blend by 39 bps, bringing its YTD excess return to 3.1%.
Over the last 10 years, the average monthly return of the Managed Risk Index has exceeded the average monthly return of a 70/30 blend by 15 bps. That translates into an average annualized excess return of 1.09% over a 70/30 blend; it generated this return with volatility that was 200 bps lower and half the drawdown.
Figure 3
The pages of these commentaries have devoted a fair amount of space to the notion that 70/30 blends cannot be expected to generate the same returns they have in recent years past. Historically-low yields leave bonds ill-equipped to contribute to returns to the degree that they did when rates were higher and gradually falling.
And yet while bonds may have lost much of their appeal as a source of meaningful returns, their value as a portfolio diversifier remains compelling.
Many, if not most versions of managed risk (MR) strategies maintain a fixed allocation to bonds. When managed risk funds reduce their equity exposure to maintain their volatility targets, the act isn’t triggered merely by the volatility of the equity component. Rather it’s the volatility of the fund as a whole that acts as the trigger for equity deallocation.
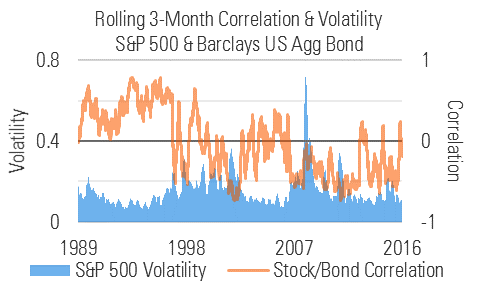
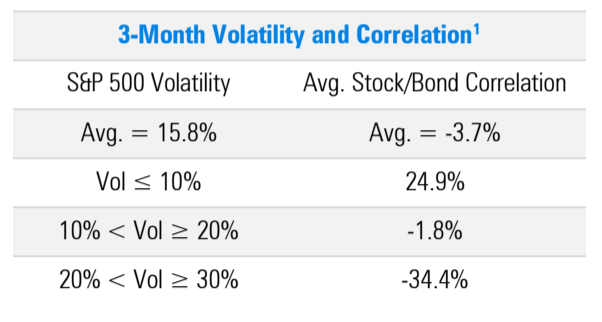
This means that the interaction between the stock and bond allocations affect a fund’s volatility and determine when and how much the equity allocation changes. Figure 4 depicts the S&P 500 rolling 3-month volatility and its correlation to the Barclays US Aggregate Bond Index. It shows that the correlation of stock and bond markets is often negative, but is particularly so during periods of higher equity market volatility:
Figure 4
An examination of average correlations across defined ranges of equity market volatility offers additional insight into the relationship between stock market volatility and stock/bond market correlation. The table in figure 5 shows that correlations tend to be lowest when stock market volatility is at its highest:
Figure 5
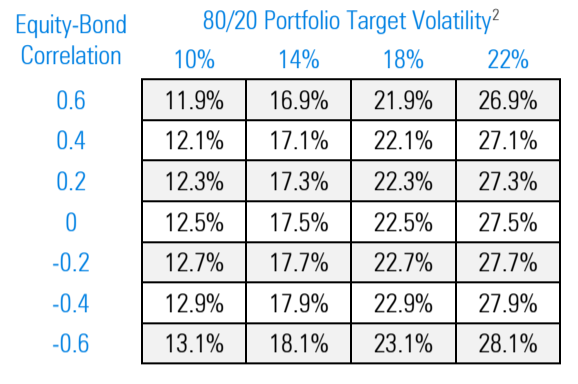
The presence of bond allocations in managed risk funds and their relationship with stock allocations means that equity volatility can exceed a fund’s target volatility and still not trigger a de-allocation. The table below depicts this relationship across various volatility targets and correlation levels.
For example, in an 80/20 fund with a 14% volatility target, when the correlation of equities to bonds is 0.4, equity volatility can climb as high as 17.1% without triggering a de-allocation:
Figure 6
Whether a MR fund maintains a fixed allocation to bonds or targets a 100% equity allocation, to the extent that deallocations from equities are moved into bonds (as opposed to cash), declining correlations reduce the amount of selling necessary to prevent the fund’s volatility from exceeding its target.
MARKET COMMENTARY
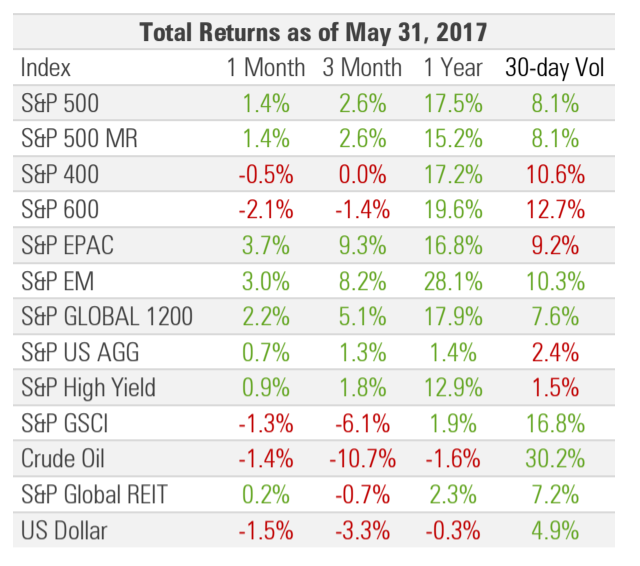
The 2.2% return for global equities in May bolstered their streak of positive returns. Over the last 15 calendar months the global equity market has generated an average monthly return of 1.7%, with only June and October producing negative returns.
With the US dollar down for its third consecutive month and fourth of the last five, non-US equities continued to lead the way. In spite of outperforming US equities by 840 bps over the last 12 months, EM equities still trade at a 40% discount to US equities, with respect to earnings, perhaps a sign of further dollar declines to come.
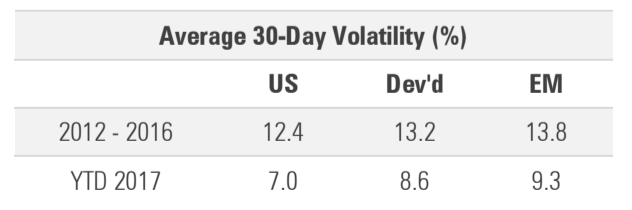
The strong YTD equity returns have coincided with below-average volatility. YTD volatility is about two-thirds of its average from the five years prior to 2017:
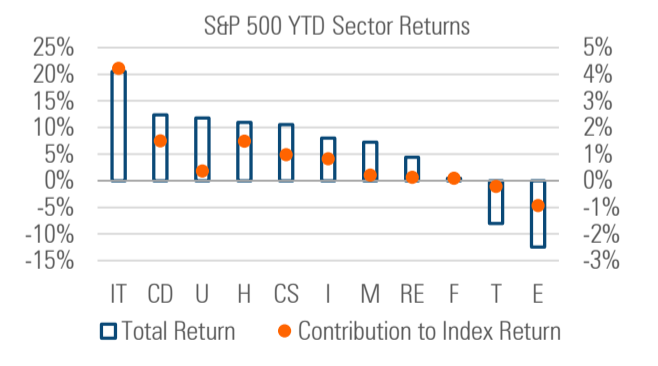
More than 80% of the YTD return of the S&P 500 is attributable to three sectors. At the start of 2017, information technology was the largest sector at 20.6% of the index. Its weight combined with its outsized YTD return has resulted in IT contributing nearly half of the index’s total YTD return.
Health care and consumer discretionary combined contribute another 30% of the return. As of the end of May, these three sectors make up 51% of the index, their largest combined weight since late 2000:
Figure 7
FIXED INCOME
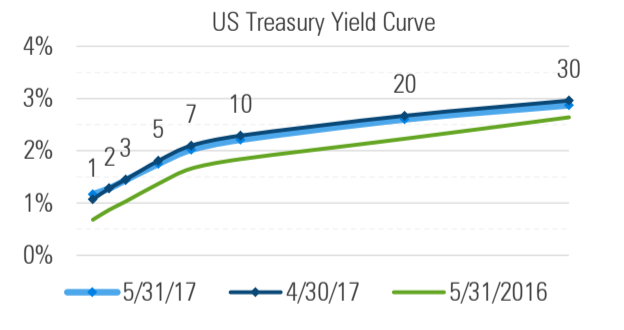
In spite of widely expected Fed rate hikes through the remainder of the year as well as ongoing talk of balance sheet reduction, rates edged lower in May. The yield curve remains higher than it was a year ago, but is also flatter, due primarily to short-term rates rising with the fed funds rate, while longer rates remain largely unchanged:
Figure 8
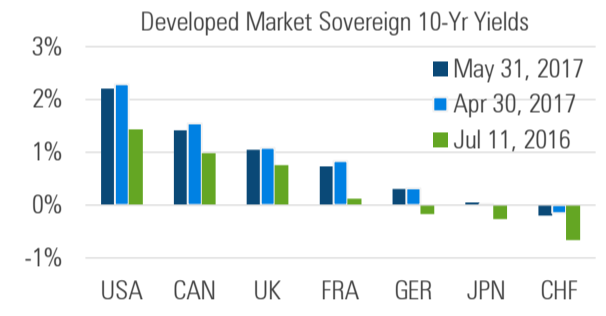
Sovereign rates in the rest of the world continue to act as an anchor to US rates. While higher than their July 2016 lows, the majority of developed sovereign bond yields currently sit at less than half of their US Treasury bond counterparts.
The 10-year bonds in France, Germany, Japan and Switzerland all yield less than 1%, with the Swiss bond incredibly continuing to trade at a negative yield.
Figure 9
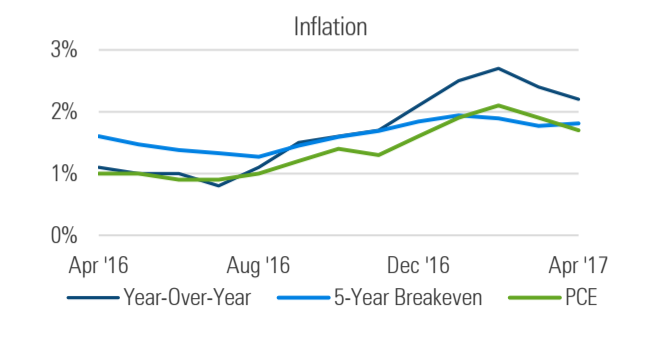
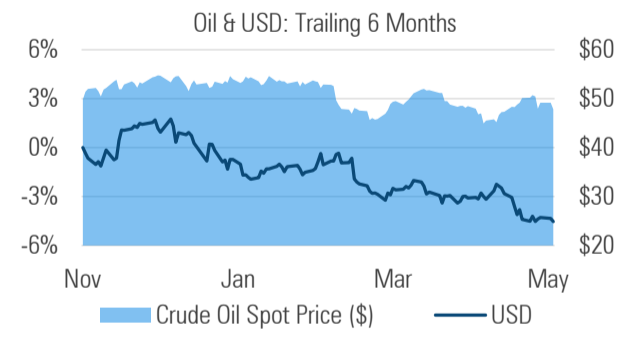
After touching 2.7% in February (its highest level since early 2012), year-over-year inflation declined for two consecutive months, reflecting the end of oil’s year-long price increase from 12 months prior:
Figure 10
Shortly after oil touched its post crisis low, the oil rig count in the US touched a nine-year low in May 2016. Over the past year the count has increased 130%, pushing US production higher and offsetting the price effects of OPEC’s efforts to reduce production. This is keeping oil’s price in a relatively tight range:
Figure 11
THE CASE FOR A MANAGED RISK APPROACH IN A LOW RISK ENVIRONMENT
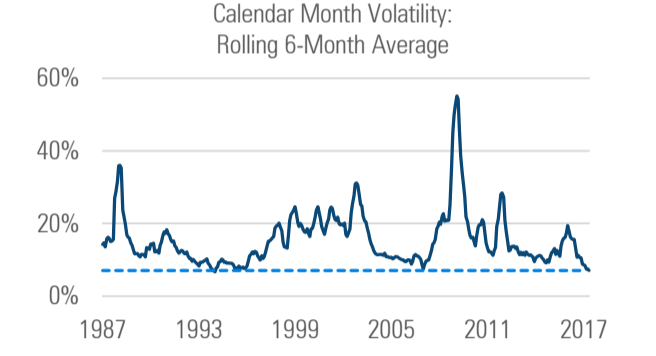
In addition to generating strong returns over the course of the past several months, markets have exhibited notably low levels of volatility. A snapshot of rolling six-month volatility shows that the six months ended May 31 rank among the lowest as of the end of May it sits near its 30-year low:
Figure 12
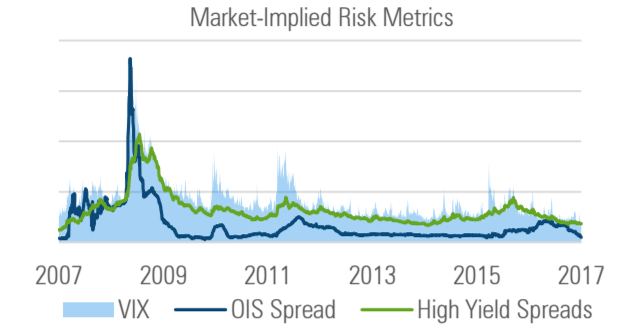
And it’s not only backward looking measures of risk that are low. More forward-looking market-based risk measures continue to hover near or below pre-crisis levels, painting a picture of smooth sailing ahead. The VIX, a measure of implied stock market volatility, the overnight indexed swap (OIS) spread, an indicator of the health of financial institutions, and high yield bond spreads, a barometer of credit and default risk, all sit near or below their 10-year lows:
Figure 13
In such an environment, it isn’t unreasonable for investors to question the need for a managed risk approach when there doesn’t appear to be little, if any, risk to be managed.
One of the features of a managed risk approach is that it adjusts to market conditions. When market volatility is low, a managed risk approach will increase its equity exposure to its respective maximum. The result is that managed risk funds participate more in equity market returns, which has been the case of late.
Having the equity allocation at its maximum does not however mean that the risk management process has been abandoned. On the contrary, the managed risk approach and all its components (volatility forecasting models, portfolio management and capital markets teams, technology infrastructure) continue to carry out their respective roles.
In this sense, financial risk management is not unlike other forms of insurance. Long stretches without fires or accidents don’t diminish the value of home and auto insurance. Similarly, when measurable market risks are low, a managed risk approach remains valuable, standing at the ready in the present to mitigate volatility and drawdowns in the future.
|
Recipients must make their own independent decisions regarding any strategies or securities or financial instruments mentioned herein. The products or services described or referenced herein may not be suitable or appropriate for the recipient. Many of the products and services described or referenced herein involve significant risks, and the recipient should not make any decision or enter into any transaction unless the recipient has fully understood all such risks and has independently determined that such decisions or transactions are appropriate for the recipient. Any discussion of risks contained herein with respect to any product or service should not be considered a disclosure of all risks or a complete discussion of the risks involved. The recipient should not construe any of the material contained herein as investment, hedging, trading, legal, regulatory, tax, accounting or other advice. The recipient should not act on any information in this document without consulting its investment, hedging, trading, legal, regulatory, tax, accounting and other advisors. The materials in this document represent the opinion of the authors and are not representative of the views of Milliman, Inc. Milliman does not certify the information, nor does it guarantee the accuracy and completeness of such information. Use of such information is voluntary and should not be relied upon unless an independent review of its accuracy and completeness has been performed. Materials may not be reproduced without the express consent of Milliman. MIL_COM_1 4/17_4/18 © 2017 Milliman Financial Risk Management LLC |
|
Milliman Financial Risk Management LLC is a global leader in financial risk management to the retirement savings industry. Milliman FRM provides investment advisory, hedging, and consulting services on over $143 billion in global assets (as of December 31, 2016). Established in 1998, the practice includes professionals operating from three trading platforms around the world (Chicago, London, and Sydney). For further information: MILLIMAN.COM/FRM |
|
Milliman is among the world's largest providers of actuarial and related products and services. The firm has consulting practices in healthcare, property & casualty insurance, life insurance and financial services, and employee benefits. Founded in 1947, Milliman is an independent firm with offices in major cities around the globe. |
|
Chicago 71 South Wacker Drive Chicago, IL 60606 +1 855 645 5462 London 11 Old Jewry Road London EC2R 8DU UK +44 0 20 7847 1557 Sydney 32 Walker Street North Sydney, NSW 2060 Australia +610 2 8090 9100 |
|
Creating transformational improvement in the retirement savings industry. |
Membership required
Membership is now required to use this feature. To learn more:
View Membership BenefitsSponsored Content
Upcoming Virtual Events View All


