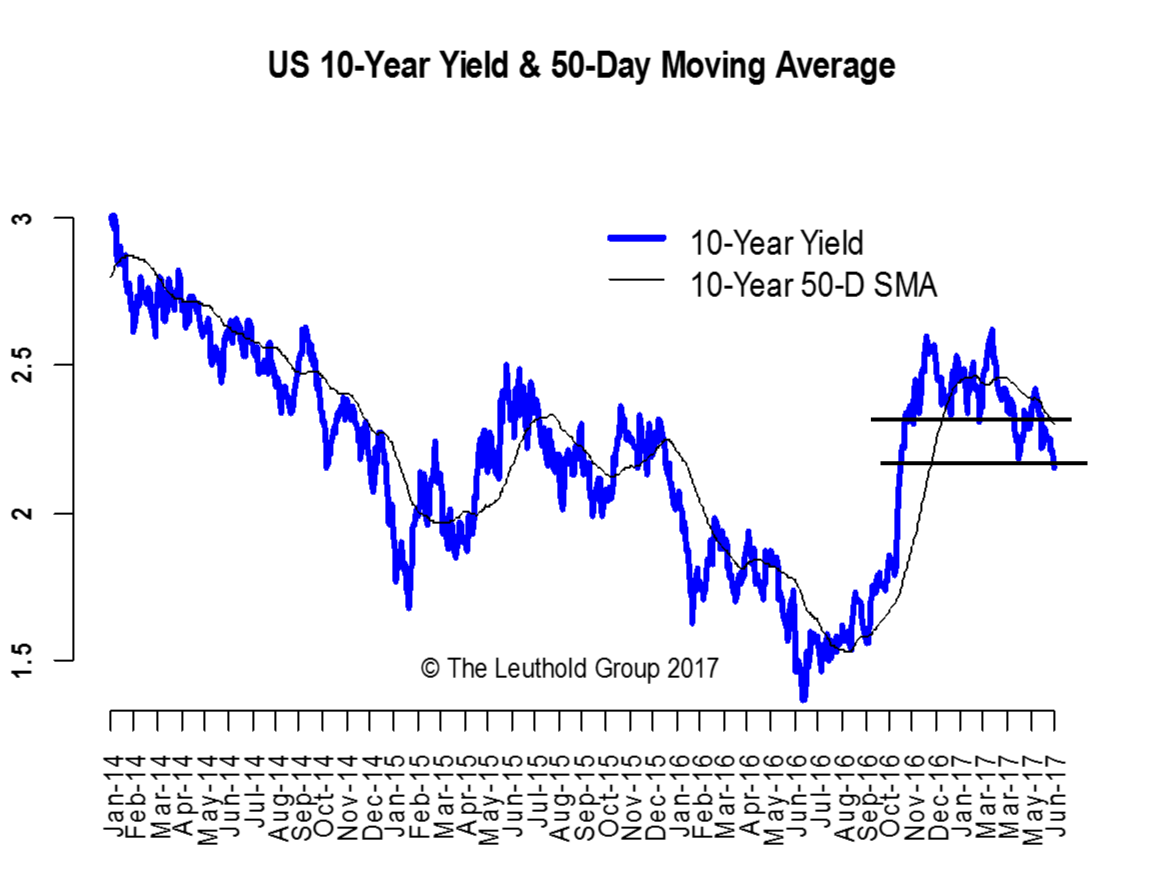
The U.S. 10-year yield ended May at 221 bps, about 8 bps lower, and then proceeded to test the 215 bps level on June 2nd, after the big miss in the May jobs report. With the 50-Day moving average trending lower and the weekly close of 215 bps marking a lower low (Chart 1), risk for even lower 10-year yields has increased. On the downside, 2% will be the next line of defense. On the upside, the 230-233 area has become a ceiling after an unsuccessful attempt to stay above it in May. The tight 215-230 range is likely to be broken as June could shape up to be a big month for volatility, with both political risks (the U.K. election and James Comey testimony), and policy risks (a full central bank meeting schedule) all coming to a head in the first half of June.

Greater uncertainty around politics and the lack of progress in pro-growth policies have dampened investor enthusiasm toward the Trump trade. So far this year, along with lower Treasury yields, we have seen inflation expectations retrace almost all of the post-election surge and the yield curve more than reverse its steepening move (Chart 2).
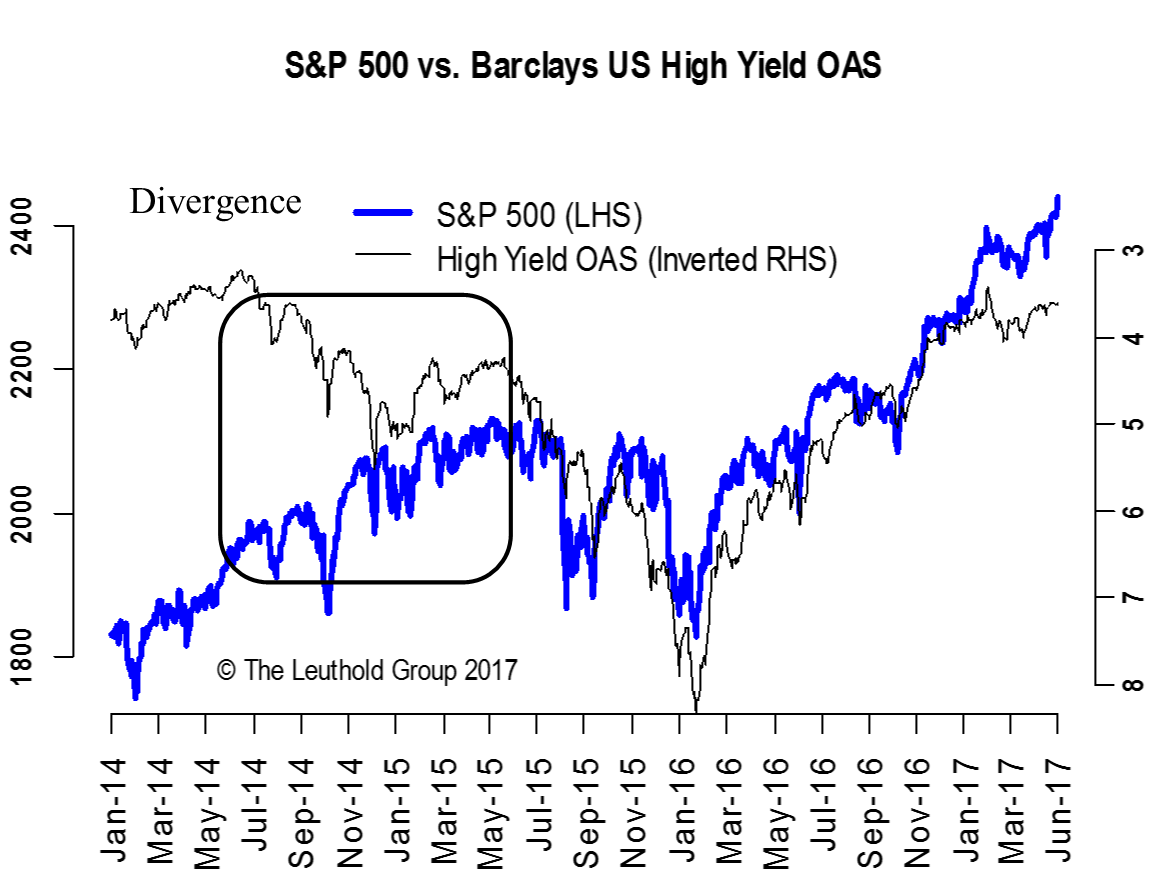
The risk rally, on the other hand, has been completely unaffected by the less optimistic message from Treasuries. Stocks are making all-time highs on a weekly basis, and High Yield bond spreads have held near recent lows and haven’t shown any significant negative divergence like we saw in 2014-15 (Chart 3).
We think the best interpretation of the current cross-asset message is the scenario of goldilocks. This is where inflation is low enough to keep the Fed on a slow and easy policy path but not so low that it puts recession/deflation fear back into the market. This goldilocks scenario does not require an imminent implementation of new policies but it does preclude the risk of a Trump impeachment. Despite higher than usual political uncertainty, there are reasons to believe goldilocks is a possible scenario for the near term.
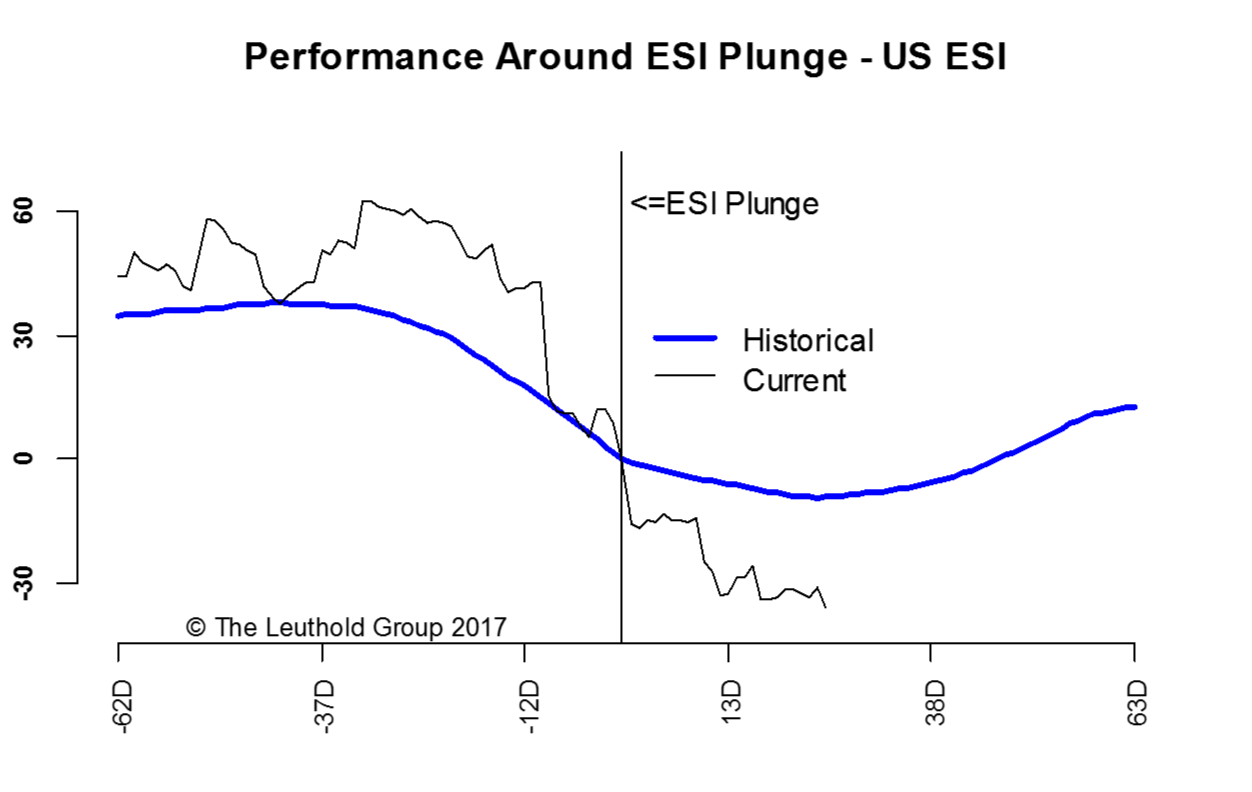
Bearish investors may very well point to the recent weakness in macro-economic data as a lack of fundamental support to the rosy prospects implied by stock market performance. Make no mistake, the Citi U.S. Economic Surprise Index (ESI) has plunged close to 100 points since March and it just made a new low of -41 after the disappointing jobs report. Last month, we mentioned that the typical pattern of the ESI suggested more downside data surprises for another month or so, and after that data would likely start to improve. Chart 4* shows that last month’s weakness shouldn’t have come as a surprise and we are likely close to the trough in data surprises. To be fair, the actual numbers were not that bad, and the disappointment was mostly a result of high expectations that have run way ahead of reality. Now that expectations have been adjusted lower, the chance of positive data surprises has increased.
*We define an ESI plunge as a move from above +30 to below 0 in the span of a month.
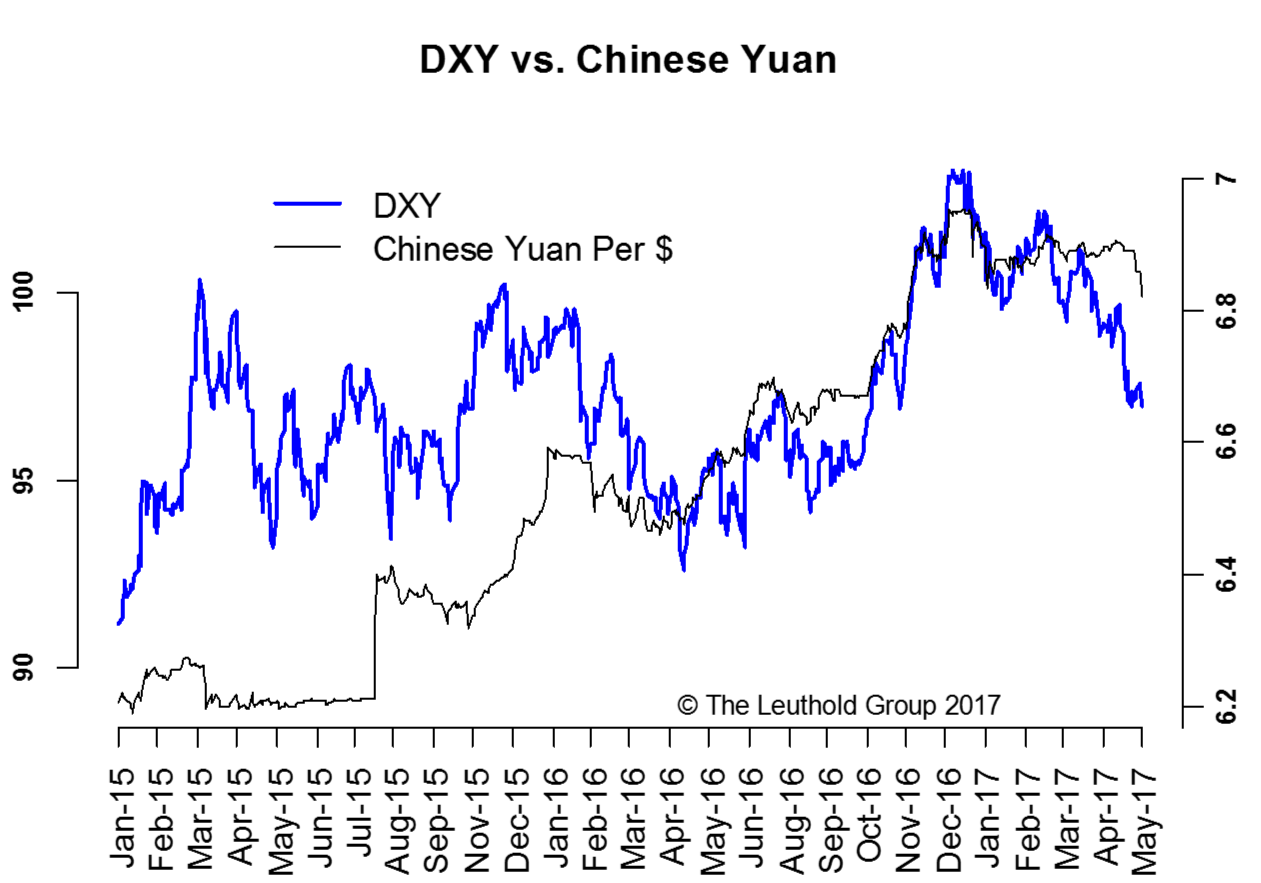
We have repeatedly stressed that financial conditions hold the key to the longevity of the current risk rally. One of the benefits of the Trump trade reversal was a weaker dollar (Chart 5). Just like a strengthening Chinese yuan, a weaker dollar is inflationary and it alleviates the impact of data weakness by loosening financial conditions and making manufacturers here more competitive.
Lower bond yields are another positive. But more for the longer horizon. Interest rates tend to lead economic cycles. Chart 6 shows lower interest rates typically lead to a higher ISM Manufacturing reading 18 months down the road. So the message here is that
the unwinding of the Trump trade is actually making financial conditions looser, which in turn makes a recession less likely, and the risk rally more sustainable, all else being equal.
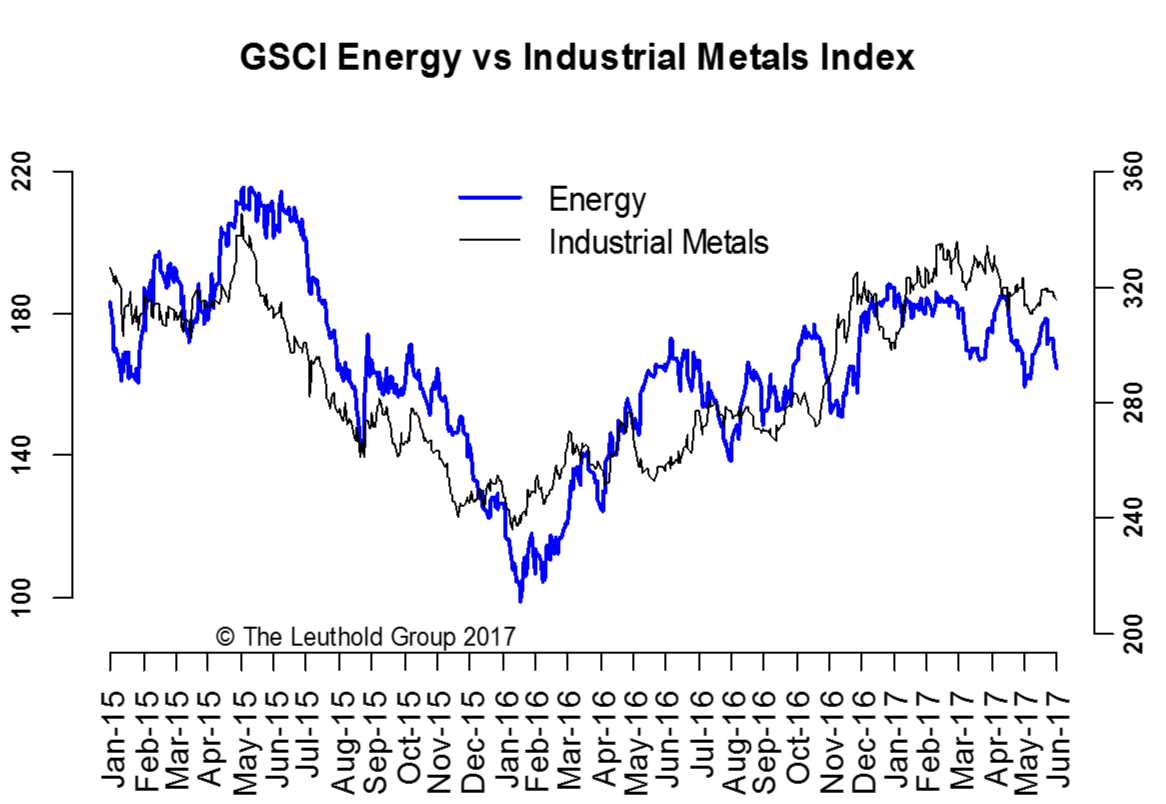
While our goldilocks view implies no imminent deflation/recession, we do recognize that inflation headwinds currently have the upper hand. Despite an extended OPEC output cut, oil prices are still looking quite vulnerable. The recent lower-high/lower-low price action in the GSCI Energy index certainly doesn’t instill confidence. Additionally, industrial metals are tracing out a similar pattern (Chart 7). If the commodity complex starts to roll over in earnest, it could quickly create problems for credit and the broader risk market.
Another concern for inflation going forward is our good old buddy, China. Sure, recent strength in the Chinese yuan offers a sign of stability, but the yuan strength was partly due to the dollar weakness, and partly due to Chinese authority’s attempt to squeeze the short-sellers after Moody’s sovereign rating downgrade. We believe a mini credit-tightening episode is currently underway in China. China’s credit growth, proxied by an aggregate of Banking, Credit, and Social Financing, has turned sharply lower in recent months (Chart 8). Coincidentally, Chinese domestic stocks and bonds have weakened, and bank stocks have also underperformed. If this credit-tightening episode gets more severe, the implication for global inflation is clearly negative.
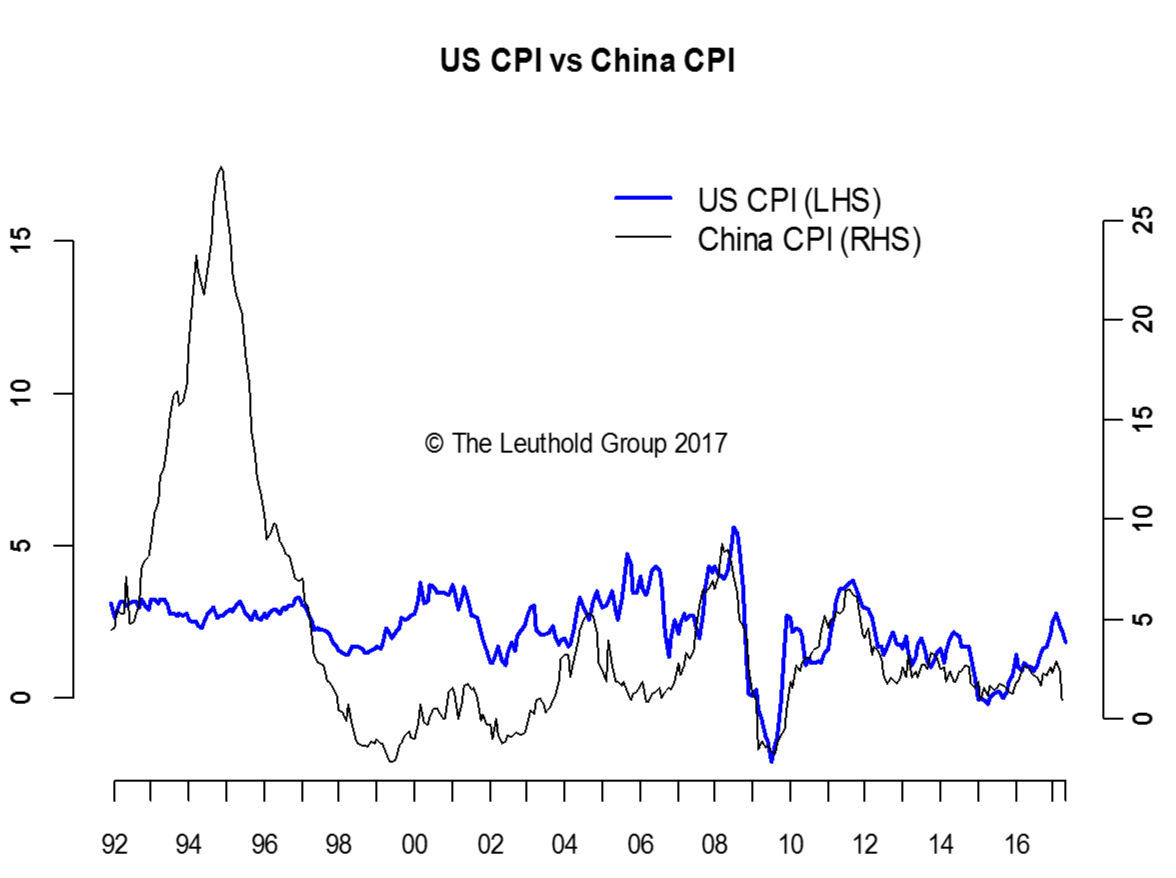
One might be tempted to question the inflation linkage between China and the rest of the world. Indeed, prior to 1997, inflation in China had no bearing on U.S. inflation (Chart 9). As China increasingly opened up its economy over the last twenty years, China CPI started to track the U.S. CPI more and more closely. Over the last ten years, they have basically moved in sync. So when it comes to the inflation outlook, China is a big deal.
All things considered, while we recognize that uncertainties abound and inflation headwinds are gaining strength, the underlying economy still shows enough vitality, and financial conditions are still favorable enough to justify our goldilocks view. Enjoy it while it lasts!
© 2017 The Leuthold Group
Read more commentaries by The Leuthold Group