Supply and Demand
We do not often write about technical concepts in our quarterly commentary. Besides being dry, they rarely provoke the type of engagement that personal stories, references to history, or even the ruminations of market wizards often do. Occasionally, however, getting a bit more detailed is important. We did a little of that last quarter where we discussed the difficulties of comparing the S&P 500 of the mid 1900s (when it was all industrials, utilities and railroads) to the index as it is composed today. We will expand on that this quarter by reviewing one of the most basic of economic concepts, supply and demand, which seems to have been placed on the backburner in today’s world of prognosticating inflation, employment, and GDP.

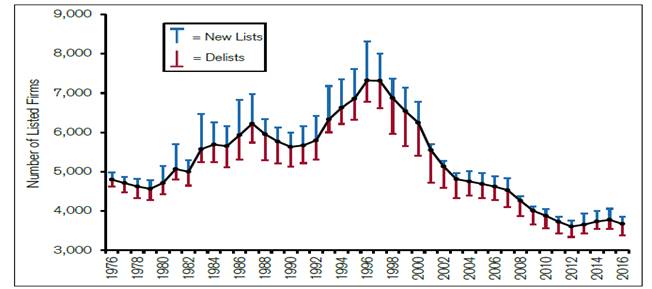
Source: (Chart) Doidge, Karolyi, and Stulz, “The U.S. Listing Gap” and Credit Suisse estimates (Bullet point data) NBER, Credit Suisse, ECGI, Bloomberg
The first point is the supply of publicly traded stock in the US. Although there has been a fair amount written about this in industry magazines and blogs, seldom does it make it out as more than a quick missive in mainstream coverage.
In short:
- The number of publicly traded stocks in the US has been in decline for roughly 20 years, falling from more than 7,500 in 1997 to under 3,700 today. The number is 1,000 smaller than it was more than 40 years ago.
- The average publicly traded company is more than 18 years old, compared to an average of 11 to 12 years old from 1976 to 1996.
- The average market cap of a US listed company is nearly $7 billion, compared to less than $1.5 billion 20 years ago ($2.3 billion inflation-adjusted).
- Merger and acquisition (M&A) activity accounted for almost 2/3rds of the reduction over the last 20 years. Private takeouts accounted for less than 10% of the activity. The rest were delisted due to bankruptcy or the inability to meet listing requirements.
- IPO activity (primary source of new public shares) has fallen precipitously since the bursting of the tech bubble, averaging nearly 300 new listings from 1976 to 2000, but just over 100 per year since (this is largely a US phenomenon, as the number of listings has increased by anywhere from 30% to 50% across other developed nations).
The reasons for what has been deemed “de-equitization” are too many to discuss in detail here, but a combination of loosened anti-trust rules, increased regulatory costs of going public, better access to capital through private channels, increased presence of overseas firms, and a structural change in how today’s businesses use money (e.g. less fixed asset investment and more R&D) are all playing a role.
That’s all well and good, but what does that mean for investors today? It means that the survivors have gotten bigger organically and through M&A. It means that these companies are older and in industries with fewer competitors. It means that they are likely growing a bit slower, but are also more apt to buy back shares and issue dividends. Bottom line, however, is that the supply of publicly traded stocks is down.
The second point is the supply of money. When the printing press was turned on and the Fed’s balance sheet ballooned from less than $500 billion to over $4.5 trillion during the Great Recession, it began an experiment (which is/was unprecedented in the US) that is hard to translate to things like Price to Earnings (P/E) multiples. This topic has been discussed ad nauseam since, with questions surrounding what Quantitative Easing (QE) means for the long haul.
The immediate and most resounding drumbeats echoed inflation. Keeping it simple, the thought was more money, same amount of stuff, equates to higher prices for the stuff. That underlying thesis, however, split into two camps: consumables inflation versus asset inflation. Unfortunately, many pundits focused on higher prices in the form of consumption such as the Consumer Price Index (CPI) which has not come to pass. The problem with CPI (and other, similar indexes) as a measure of inflation is that it excludes all investment assets. From the Bureau of Labor Statistics – “The CPI does not include investment items, such as stocks, bonds, real estate, and life insurance. (These items relate to savings and not to day-to-day consumption expenses).” If, on the other hand, we focus on asset price inflation, we can theoretically account for part of the run since the Great Recession. This does not even consider the more fundamental ramifications of QE, which reduced the cost of borrowing for many operators. Cheaper cost of capital reduces the discount mechanism used to value assets. In other words, asset prices rose as QE shrunk the denominator.
So, is all this reasonable? This is very hard to measure, and what we offer below should not be used as a gauge for valuations, but another viewpoint for what is happening with asset prices today.
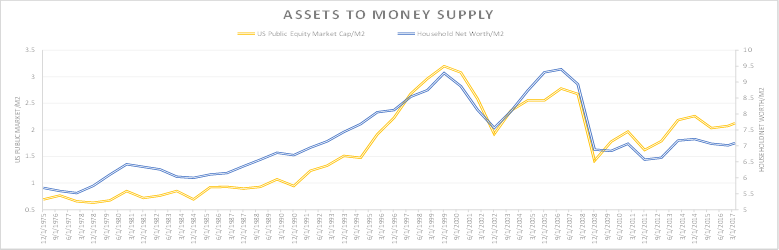
Source: Bloomberg, FRED, IMF, World Bank
The chart above reflects the total market cap of publicly traded US equities (today around $27 trillion) divided by money supply (M2 at roughly $13 trillion). The second line goes broader, and shows household net worth ($94 trillion in household ownership of stocks/bonds/real estate minus liabilities) divided by money supply (same M2). The tech and housing bubbles show up clearly.
What we ultimately get is asset inflation not only from the QE component but also from the reduced supply of stock. It is a variable that does not fit cleanly in the general discussion of market prospects, but one that should not be ignored. For our part (even taking the above into consideration), we continue to beat the drum of lowering return expectations in lieu of current market valuations and historically low yields coming from core bonds.
Markets
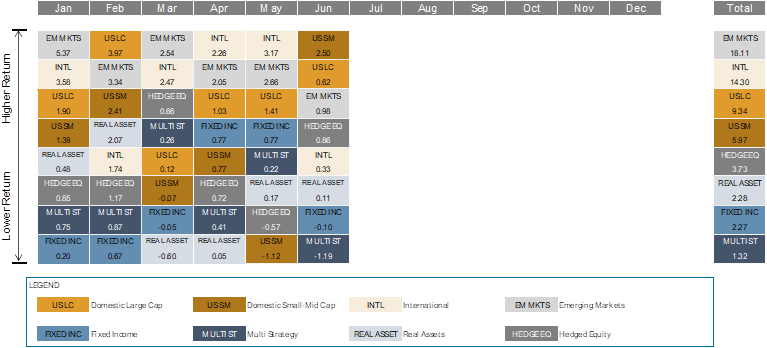
Source: Morningstar, Bloomberg
“Vive la France!” At least that was the market sentiment in Q2 after a pro-Euro election result calmed investors. Within equity markets, there was a continuation of Q1 trends with momentum and growth beating value, large beating small, and low dividend yield beating high. Energy, one of the darlings of the post-election bump, continued to lag in the second quarter, domestically and abroad.
US large company stocks (represented by the S&P 500 Index) appreciated 3.1% for the quarter. US small-mid company stocks (represented by the Russell 2500 Index) rose 2.1%. International stocks (represented by the MSCI ACWI ex US IMI Index) bettered domestic at 6.1% and Emerging Market stocks (represented by the MSCI EM IMI Index) rose 5.9%. At the country level, France, China and Italy all topped 8% for the quarter. Russia (-10.0%) and Brazil (-6.7%) were the laggards.
The US Bond market continued to chug along post the March and through the June Fed rate hikes. The curve flattened through much of the quarter, only to reverse course in the last week of the month. The Barclays Capital US Aggregate Bond Index rose another 1.5% in Q2, bringing YTD returns to 2.3%. The yield on the 10-Year Treasury began and finished at around 2.35% in Q2, despite falling to nearly 2.1% in June. Municipal bonds rose 1.4% for the quarter while international bonds also fared well, thanks in part to a weakening US dollar. The more credit-oriented areas of the market continued to perform well, with high-yield bonds rising 2.2% in the second quarter.
There were no major standouts within alternatives in Q2. Multi-strategy funds (represented by the HFRI FoF Diversified Index) rose 1.3% for the quarter. Hedged equity managers (represented by the HFRX Equity Hedge Index) rose 2.3%. REITs in the US finished up 1.7%, but abroad they rose 5.0%. Global Infrastructure led real assets with a return of 2.5%, thanks to strong performance in Europe and Japan, though a negative return in US energy infrastructure was a headwind. Commodities (-3.0%) were the laggard, thanks to continued weakness in energy (-9.7%).
Some Thoughts
- Economic expansion in the US has been slow, but steady. Now entering its ninth year, this is the third longest expansion since 1900.
- After showing signs of strength earlier in the year, the fall in oil prices has put pressure on inflation/CPI in the US. With the dollar weakening against global currencies and continued tightening of the labor market, inflation could again rise throughout the rest of the year.
- With a weak currency, rising confidence and pent-up demand after a number of years of slow/no growth, the Eurozone is leading the charge in the global economy.
- Long-term interest rates remain stubbornly low. As the Fed continues to raise short-term rates and reduce its balance sheet, total returns for most high quality bonds will generally suffer.
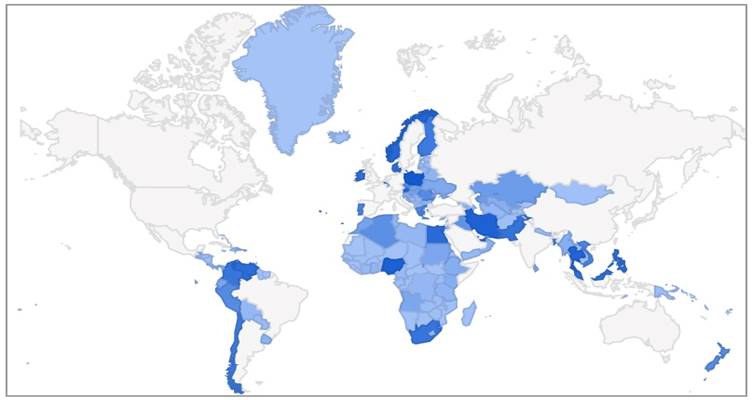
- “Combined Revenue of Facebook, Google, Apple, & Amazon Exceeds the GDP of 88% of Countries Worldwide - These four companies earned over $470 Billion in revenue during the 2016 calendar year. Only a handful of countries have economies that large. The countries marked in blue have a GDP less than the annual revenue generated by these companies.” (Source: Accompany)
--
Bronfman E.L. Rothschild is a registered investment advisor (dba Bronfman Rothschild). Securities, when offered, are offered through an affiliate, Bronfman E.L. Rothschild Capital, LLC (dba BELR Capital, LLC), member FINRA/SIPC.
This information should not be construed as a recommendation, offer to sell, or solicitation of an offer to buy a particular security or investment strategy. The commentary provided is for informational purposes only and should not be relied upon for accounting, legal, or tax advice. While the information is deemed reliable, Bronfman Rothschild cannot guarantee its accuracy, completeness, or suitability for any purpose, and makes no warranties with regard to the results to be obtained from its use. Past performance does not guarantee future results.
© 2017 Bronfman Rothschild
Read more commentaries by Bronfman E.L. Rothschild