Can markets repeat the outstanding performance of 2017? Russ discusses why credit market conditions are likely to provide the key clues.
Calm. Still. Halcyon. Serene. Placid. These are just a few of the adjectives that will invariably be used to describe last year’s stock market. In this case however, numbers, two in particular, illustrate better than words. According to Goldman Sachs, realized volatility for the S&P 500 was 6.7% last year, the second lowest on record. 2017 was also the only year on record in which the S&P 500 delivered a positive total return in every month of the year. A 20% return with no downside is literally as good as it gets.
Which of course leaves investors wondering if there is even the slightest chance we’ll be equally lucky in 2018. While the list of scenarios and events that can disrupt markets is endless, there is at least one quantifiable metric to watch: financial market conditions measured by credit spreads.
In the long term, valuations and the economic cycle, i.e. recessions, tend to drive performance; in the short term, both are less critical. In trying to forecast more common, “garden variety” corrections, financial market conditions have historically been more relevant than the next economic release. From my perspective, one big reason why 2017 was such a calm year for stocks was that it was an exceptionally calm year for credit.
Steady as she goes
To illustrate, it is useful to compare 2017 with late 2015/early 2016. Last year, credit markets turned in a remarkably steady performance. Not only were credit markets well-behaved on a year-over-year basis, they were calm throughout the entire year.
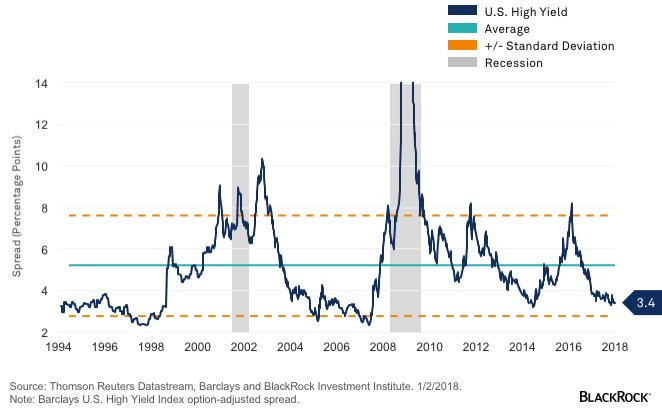
A typical measure of credit conditions are “spreads”—the difference between the yield of 10-year U.S. Treasury bonds and that of riskier bonds, such as high yield. When spreads are increasing, it is usually a sign of a selloff in risky bonds and buying of Treasuries. In 2017, high yield spreads (based on the Barclays High Yield Index) declined in 8 of 12 months, with relatively minor spread widening, 20 to 25 basis points (bps, or .20 to .25 percentage points) in March and August (see the chart below). By comparison, spreads increased by nearly 60 bps in December of 2015 and by roughly 75 bps in January of 2016.
U.S. high yield

This is important as rising spreads are one of the better leading indicators of market corrections. As monthly changes in credit spreads tend to be correlated, i.e. rising spreads in one month are often followed by a further rise the next month, spread widening often precedes equity market corrections.
Looking back over the past 60 years, changes of one standard deviation or more, roughly 60 bps, in credit spreads raise the odds of a 5% or bigger correction from 8.5% to more than 16%. Put differently, a 5% or greater correction is two times more likely to occur when credit spreads jumped in the previous month.
2018 seems to be starting where 2017 ended: a synchronized global recovery with low inflation and still benign financial market conditions. True, U.S. equity valuations are elevated, but this tells us little about the next few quarters. In summary, conditions still seem similar to the ideal ones we saw last year. But when this finally starts to change, credit markets will probably provide the first clue.
Russ Koesterich, CFA, is Portfolio Manager for BlackRock’s Global Allocation team and is a regular contributor to The Blog.
Investing involves risks, including possible loss of principal. Fixed income risks include interest-rate and credit risk. Typically, when interest rates rise, there is a corresponding decline in bond values. Credit risk refers to the possibility that the bond issuer will not be able to make principal and interest payments. Non-investment-grade debt securities (high-yield/junk bonds) may be subject to greater market fluctuations, risk of default or loss of income and principal than higher-rated securities.
This material is not intended to be relied upon as a forecast, research or investment advice, and is not a recommendation, offer or solicitation to buy or sell any securities or to adopt any investment strategy. The opinions expressed are as of January 2018 and may change as subsequent conditions vary. The information and opinions contained in this post are derived from proprietary and nonproprietary sources deemed by BlackRock to be reliable, are not necessarily all-inclusive and are not guaranteed as to accuracy. As such, no warranty of accuracy or reliability is given and no responsibility arising in any other way for errors and omissions (including responsibility to any person by reason of negligence) is accepted by BlackRock, its officers, employees or agents. This post may contain “forward-looking” information that is not purely historical in nature. Such information may include, among other things, projections and forecasts. There is no guarantee that any forecasts made will come to pass. Reliance upon information in this post is at the sole discretion of the reader. Past performance is no guarantee of future results. Index performance is shown for illustrative purposes only. You cannot invest directly in an index.
©2017 BlackRock, Inc. All rights reserved. BLACKROCK is a registered trademark of BlackRock, Inc., or its subsidiaries in the United States and elsewhere. All other marks are the property of their respective owners.
347222
© BlackRock
Read more commentaries by BlackRock