Coming on the heels of the unflappable market of 2017, the latest spike in volatility and performance pressures for equities has some investors on edge. Sporadic up and down movements for the major indices are a faint memory for those who have grown used to the steady march higher for stocks.
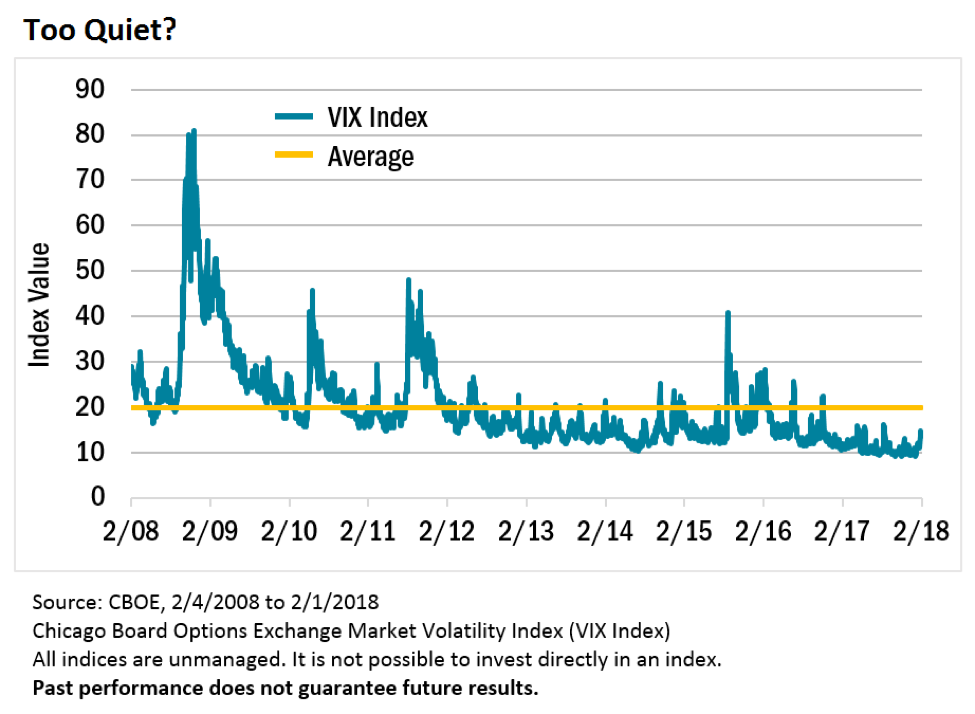
Yet as the chart shows, the extreme calm during the past 13 months was anything but ordinary. Last year, the Chicago Board Options Exchange Volatility Index (VIX) closed below 10% on 52 trading days— compared to zero days in the nine years preceding 2017. Even the recent Feb. 2 spike to 17.5% was below the 10-year average of nearly 20%.

We view the recent uptick in volatility and pullback in prices as long overdue and a healthy development against a still-robust economic backdrop. The return to the historic norm points to price movements driven by company fundamentals and could provide opportunities for active investors going forward.
Disclosure:
Past performance does not guarantee future results.
Investing involves risk, including the potential loss of principal.
There is no guarantee that a particular investment strategy will be successful.
Value investments are subject to the risk that their intrinsic value may not be recognized by the broad market.
The statements and opinions expressed in the articles or appearances are those of the presenter. Any discussion of investments and investment strategies represents the presenters' views as of the date created and are subject to change without notice. The opinions expressed are for general information only and are not intended to provide specific advice or recommendations for any individual. Any forecasts may not prove to be true.
Economic predictions are based on estimates and are subject to change.
CFA® is a registered trademark owned by the CFA Institute.
Definitions: The Chicago Board Options Exchange Market Volatility Index (CBOE VIX) is a popular measure of the implied volatility of S&P 500 index options. Often referred to as the fear index or the fear gauge, it represents one measure of the market's expectation of stock market volatility over the next 30-day period. Volatility is a statistical measure of the dispersion of returns for a given security or market index, which can either be measured by using the standard deviation or variance between returns from that same security or market index.
©2018 Heartland Advisors heartlandadvisors.com
2018461
© Heartland Advisors
Read more commentaries by Heartland Advisors