Chart of the week
Price Change of Long and Short VIX ETPs
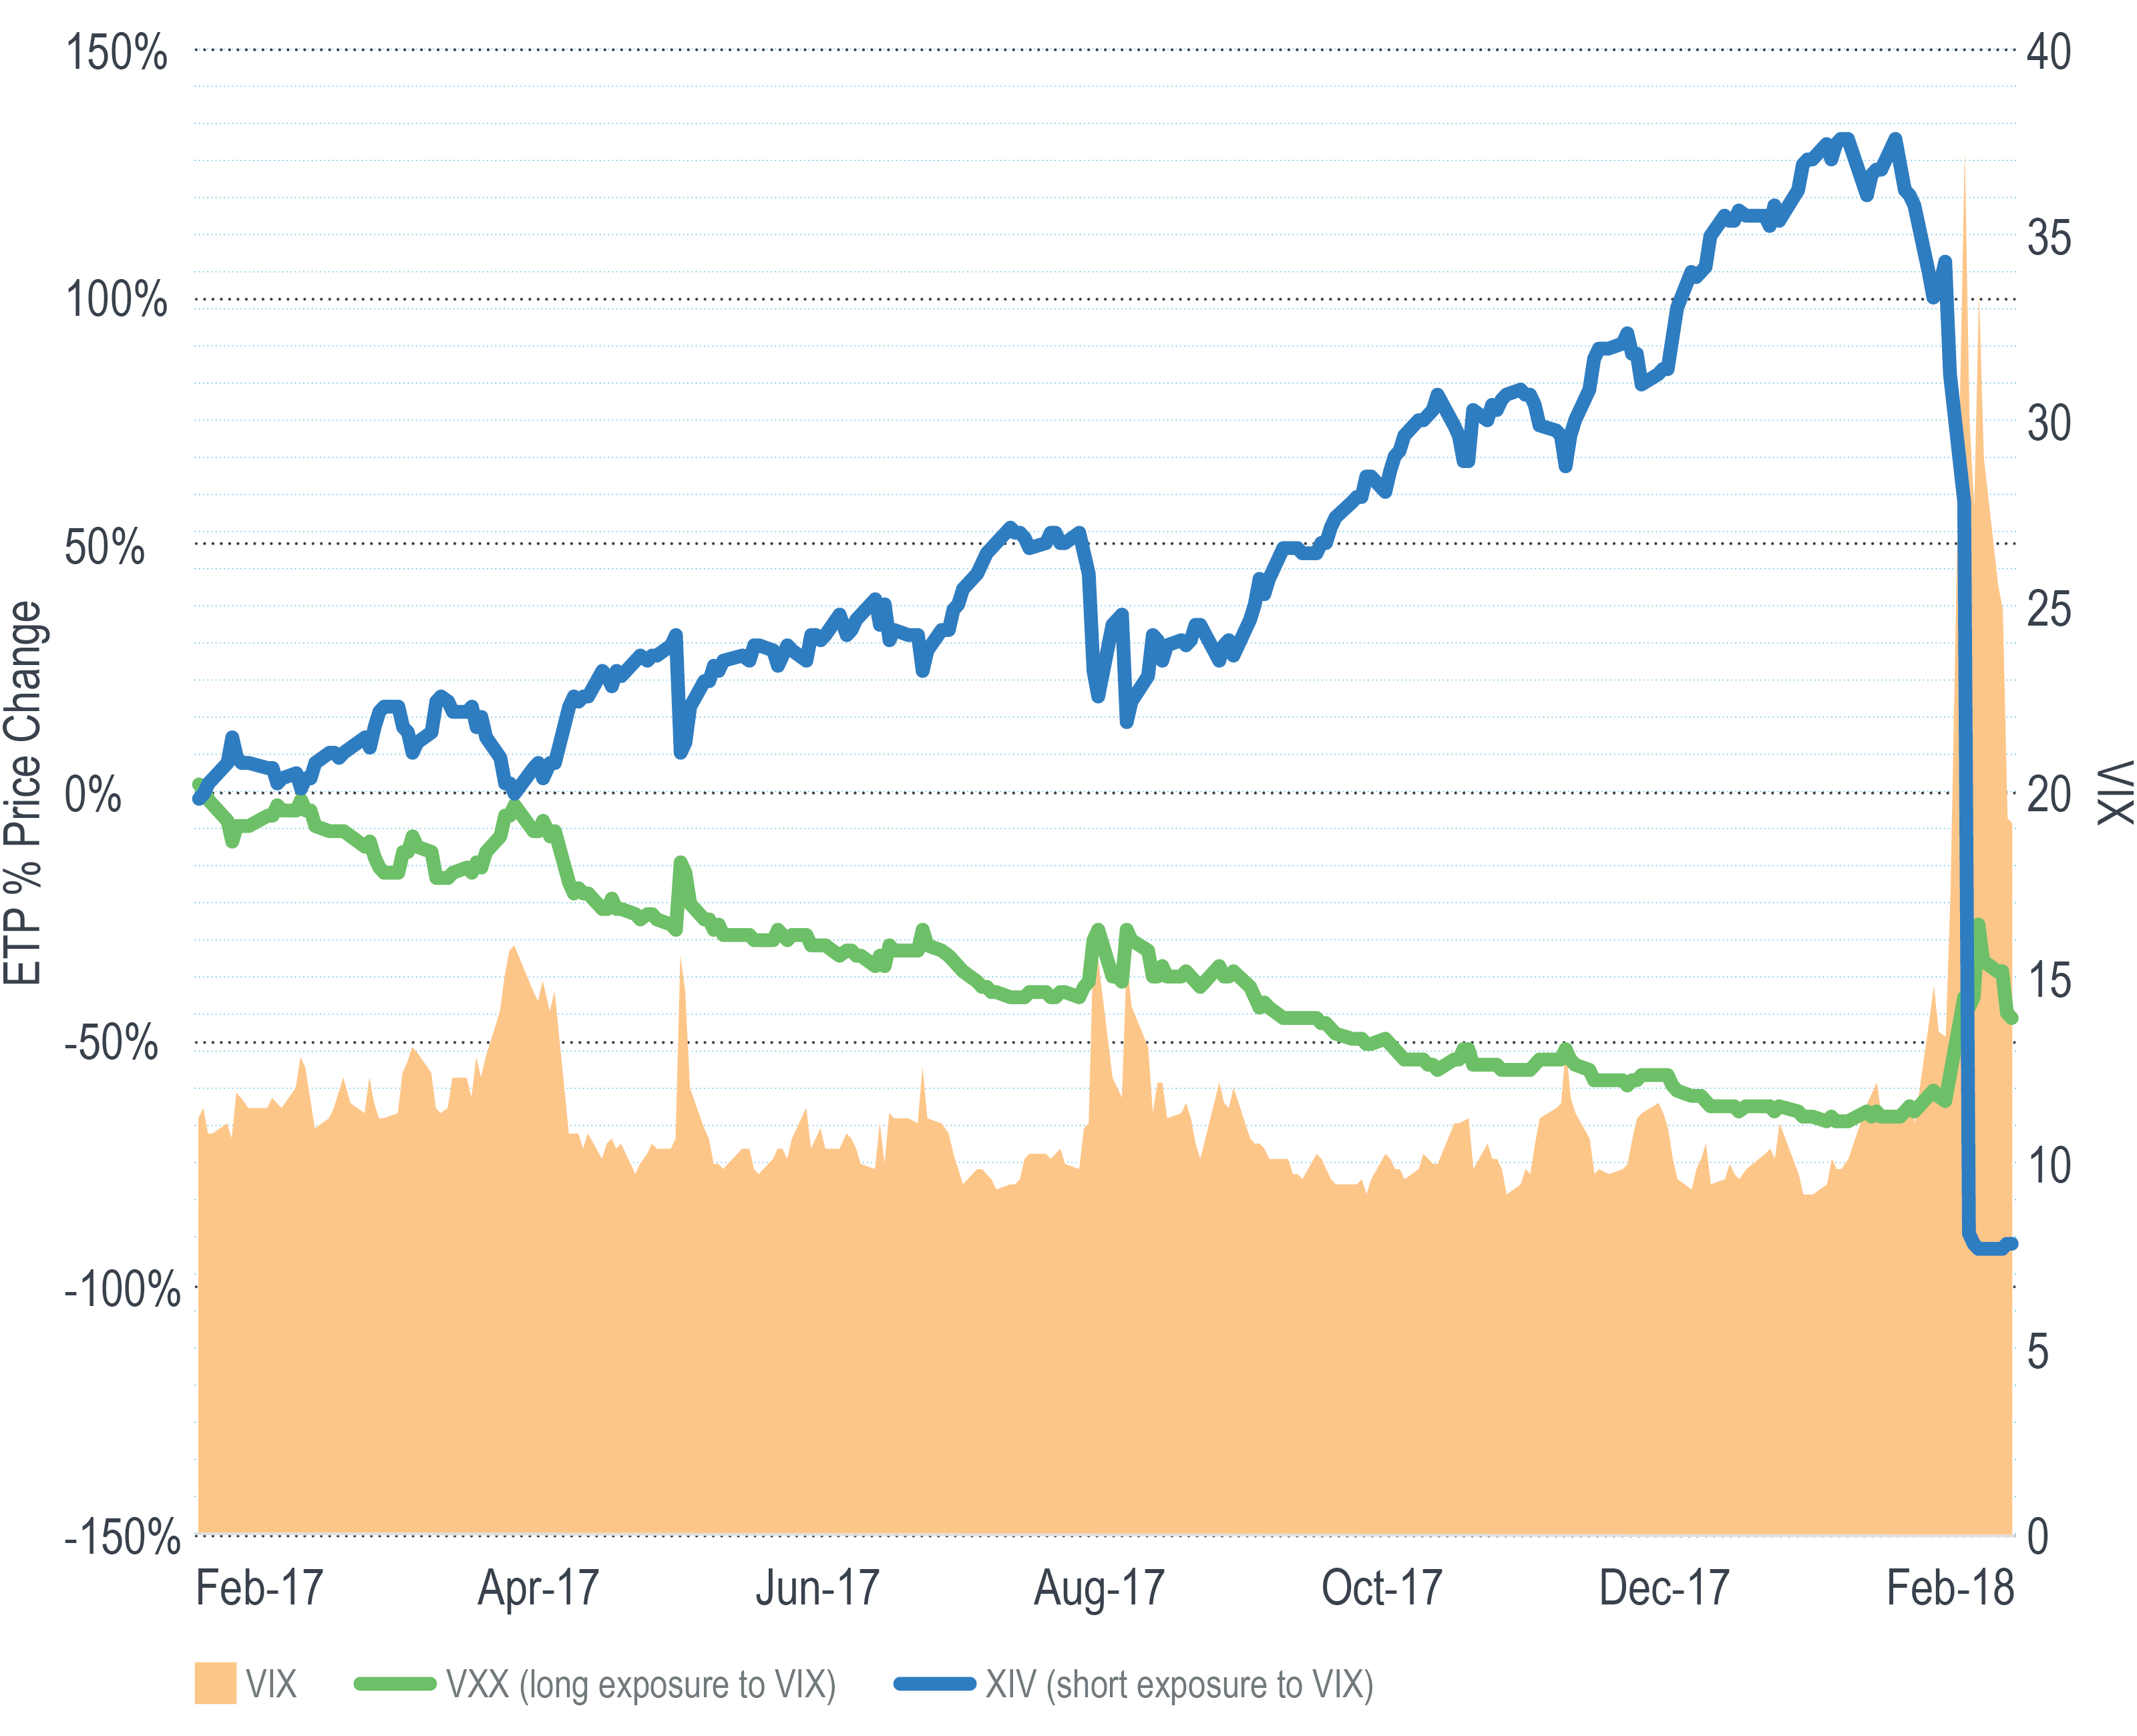
As low volatility persisted through 2017, products that offer inverse exposure to the VIX saw significant increases in both their popularity and price.
For example, during the 12 months ended Jan. 31, 2018, the VelocityShares Daily Inverse VIX ETN (ticker XIV) experienced a 107% price increase and saw more than $650 million of net inflows. With volatility remaining stable and the VIX futures curve positively sloped, short exposure to the VIX during this period proved to be a profitable trade.
That all changed in early February when the VIX moved sharply higher. Over the course of just five trading days, XIV’s price went from $129.35 to $5.10, a decline of 96%.
Conversely, the price of the iPath S&P 500 VIX ETN (VXX) increased as the VIX moved higher, climbing by 90% over the same five-day period. While this move is large on an absolute basis, it came on the heels of a 12-month 61% decline. February’s move helped VXX recover some of that loss, but it was still well short of the 160% gain necessary to break even.

Looking back on these circumstances, at least two observations can be made:
- Products that offer explicit short exposure to the VIX have the potential to experience outsized losses in a relatively short amount of time.
- Products that offer long exposure to the VIX may be expensive when used as an ongoing risk-management solution and may not make up for their cost (i.e. losses) even when they do finally react to higher volatility.
Unless otherwise noted, data is sourced from Bloomberg.
Recipients must make their own independent decisions regarding any strategies or securities or financial instruments mentioned herein.
The products or services described or referenced herein may not be suitable or appropriate for the recipient. Many of the products and services described or referenced herein involve significant risks, and the recipient should not make any decision or enter into any transaction unless the recipient has fully understood all such risks and has independently determined that such decisions or transactions are appropriate for the recipient.
The results shown are historical, for informational purposes only, and do not guarantee future results.
Any discussion of risks contained herein with respect to any product or service should not be considered a disclosure of all risks or a complete discussion of the risks involved.
The recipient should not construe any of the material contained herein as investment, hedging, trading, legal, regulatory, tax, accounting or other advice. The recipient should not act on any information in this document without consulting its investment, hedging, trading, legal, regulatory, tax, accounting and other advisors.
The materials in this document represent the opinion of the authors and are not representative of the views of Milliman, Inc. Milliman does not certify the information, nor does it guarantee the accuracy and completeness of such information. Use of such information is voluntary and should not be relied upon unless an independent review of its accuracy and completeness has been performed. Materials may not be reproduced without the express consent of Milliman.
Data included in this document has been sourced from providers that Milliman FRM believes to be reliable from information available publicly or with consent of the provider of the source material. To the fullest extent permitted by law, no representation or warranty, express or implied is made by Milliman FRM as to the accuracy or completeness of the source data or any other information in this document.
For financial professional use only. Not intended for public distribution.


