March Validated February’s Initiation Of A New, Higher Volatility Regime
by Joe Becker of Milliman FRM,
Learn more about this firm
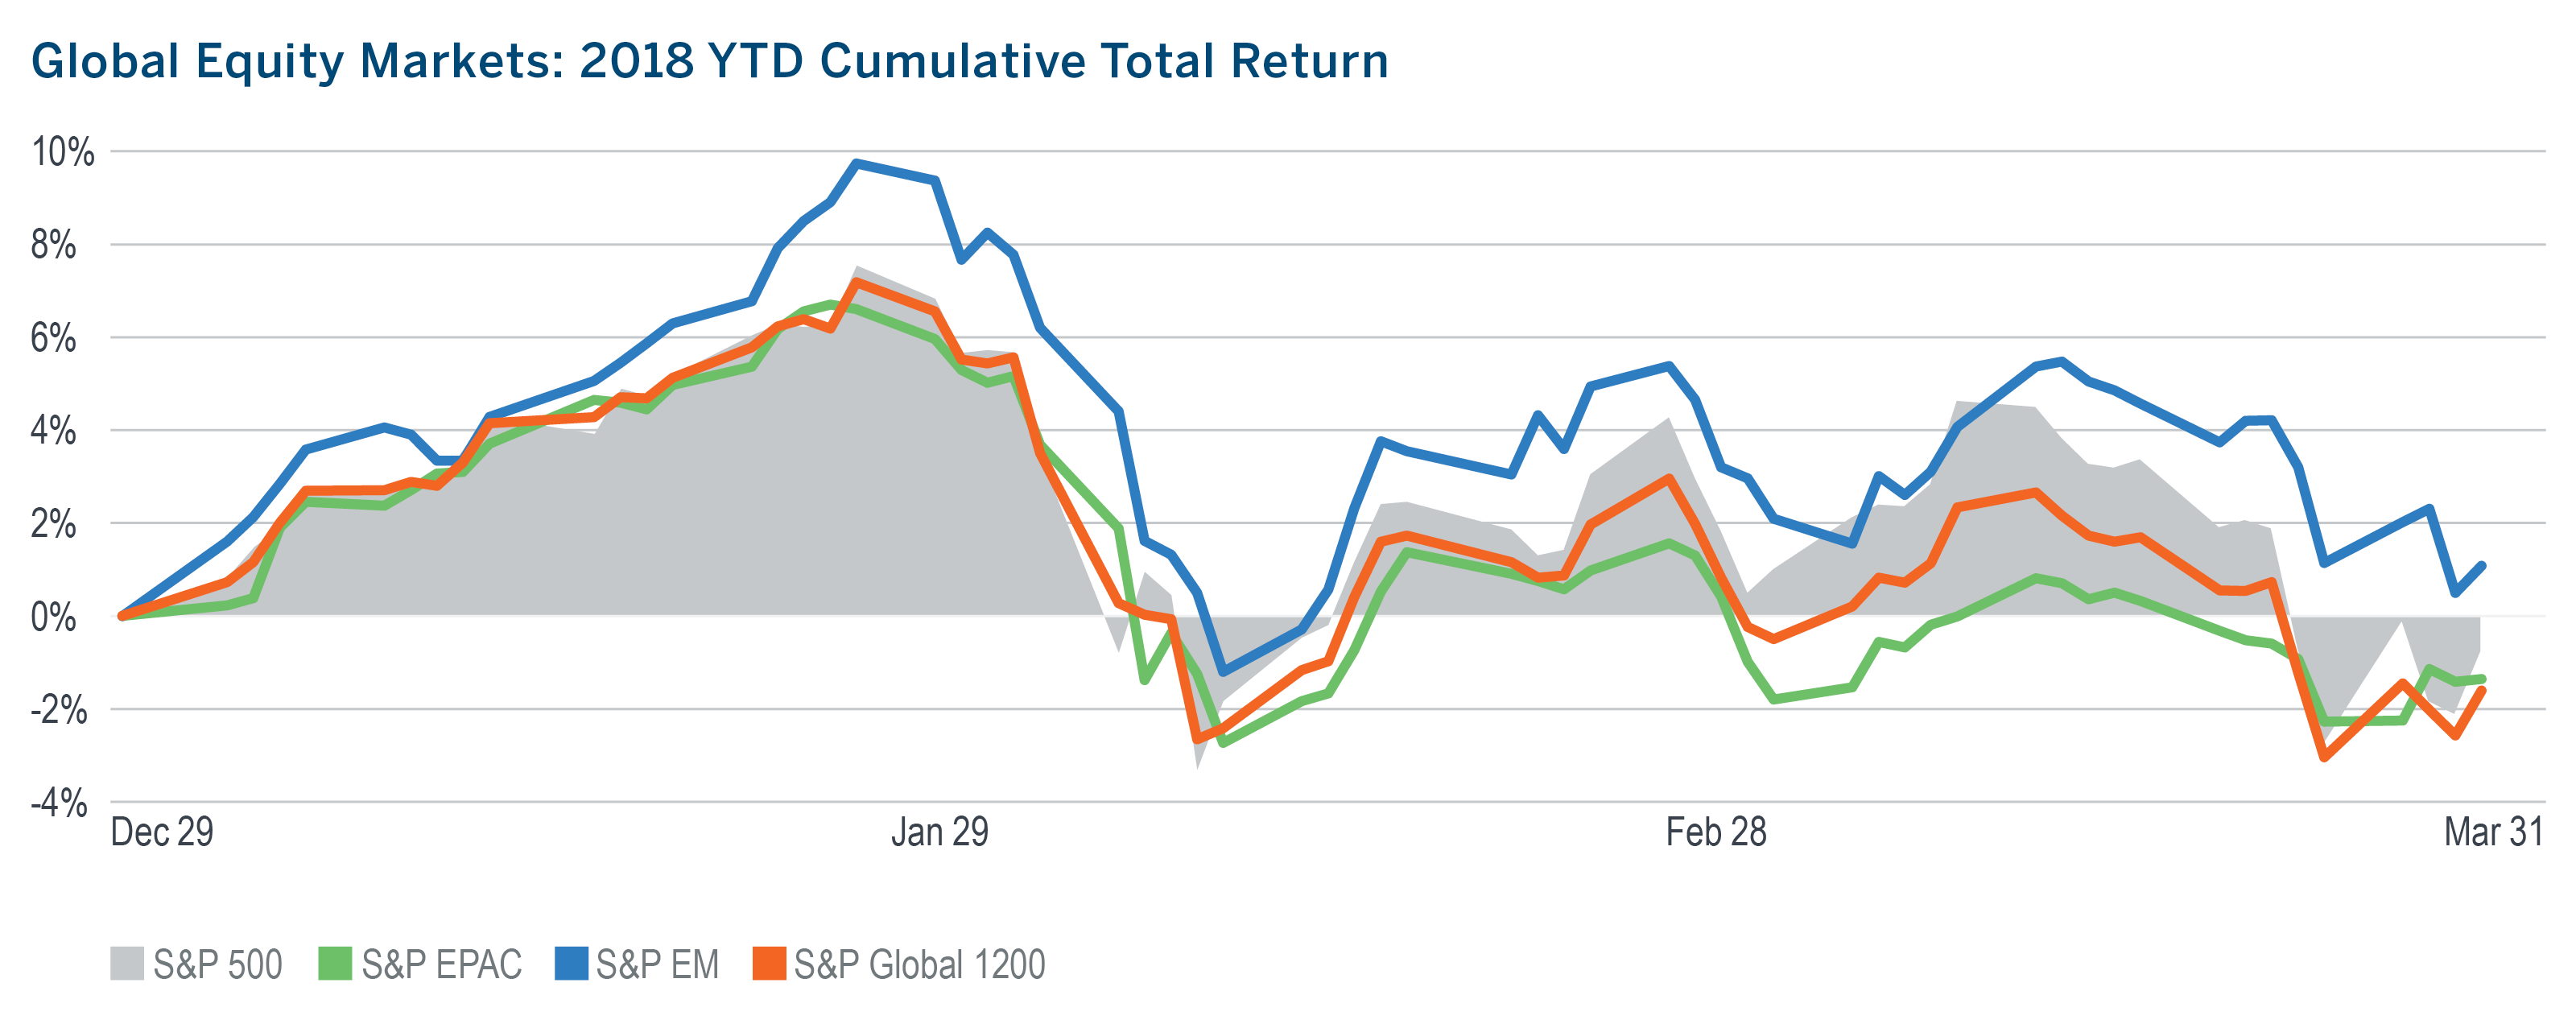
- March capped off the S&P 500’s first negative quarterly return since Q3 2015 and the first negative Q1 since 2009.
- After not experiencing a single daily move of more than 2% through all of 2017, the S&P 500 has now seen 6 such moves through February and March.
- If “taper tantrum” was an fitting moniker for the 2013 reaction to the prospect of ending the Fed’s QE, the volatility in early 2018 might well be referred to as the “tightening, tech, trade-tariff tantrum,” as markets reacted to tighter monetary policy, a data breach at Facebook and the prospect of a tariff-induced trade war.
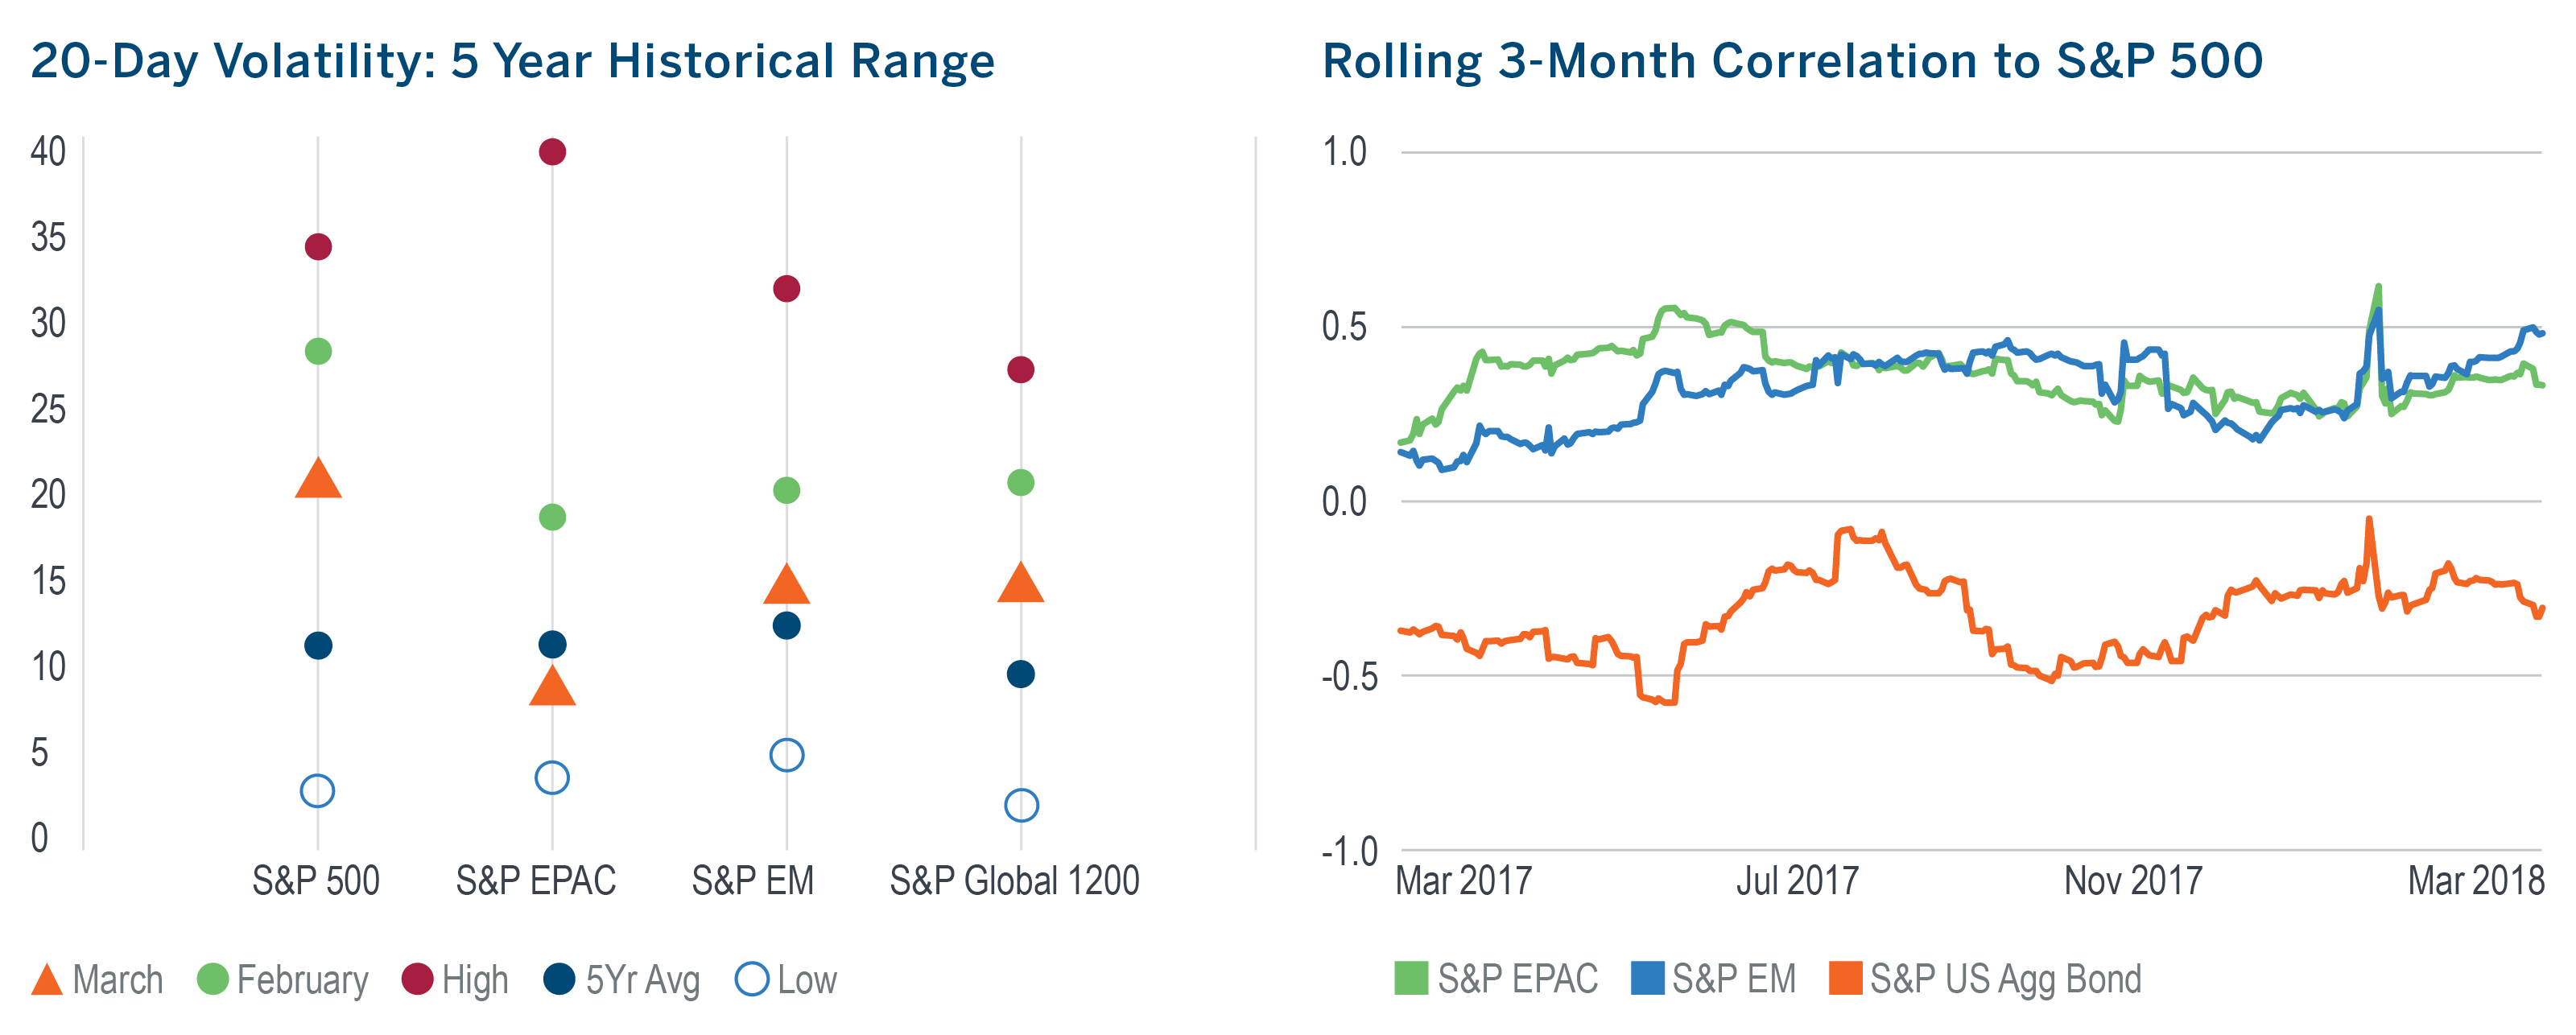
- While not as high as it was in February, volatility in March was still above its five-year average and much higher than it was in 2017.
- Falling interest rates boosted the U.S. Aggregate bond market, reducing its correlation to equities and improving it as a diversifier, while the correlation between U.S. and foreign equities increased.
Managed Risk Investing
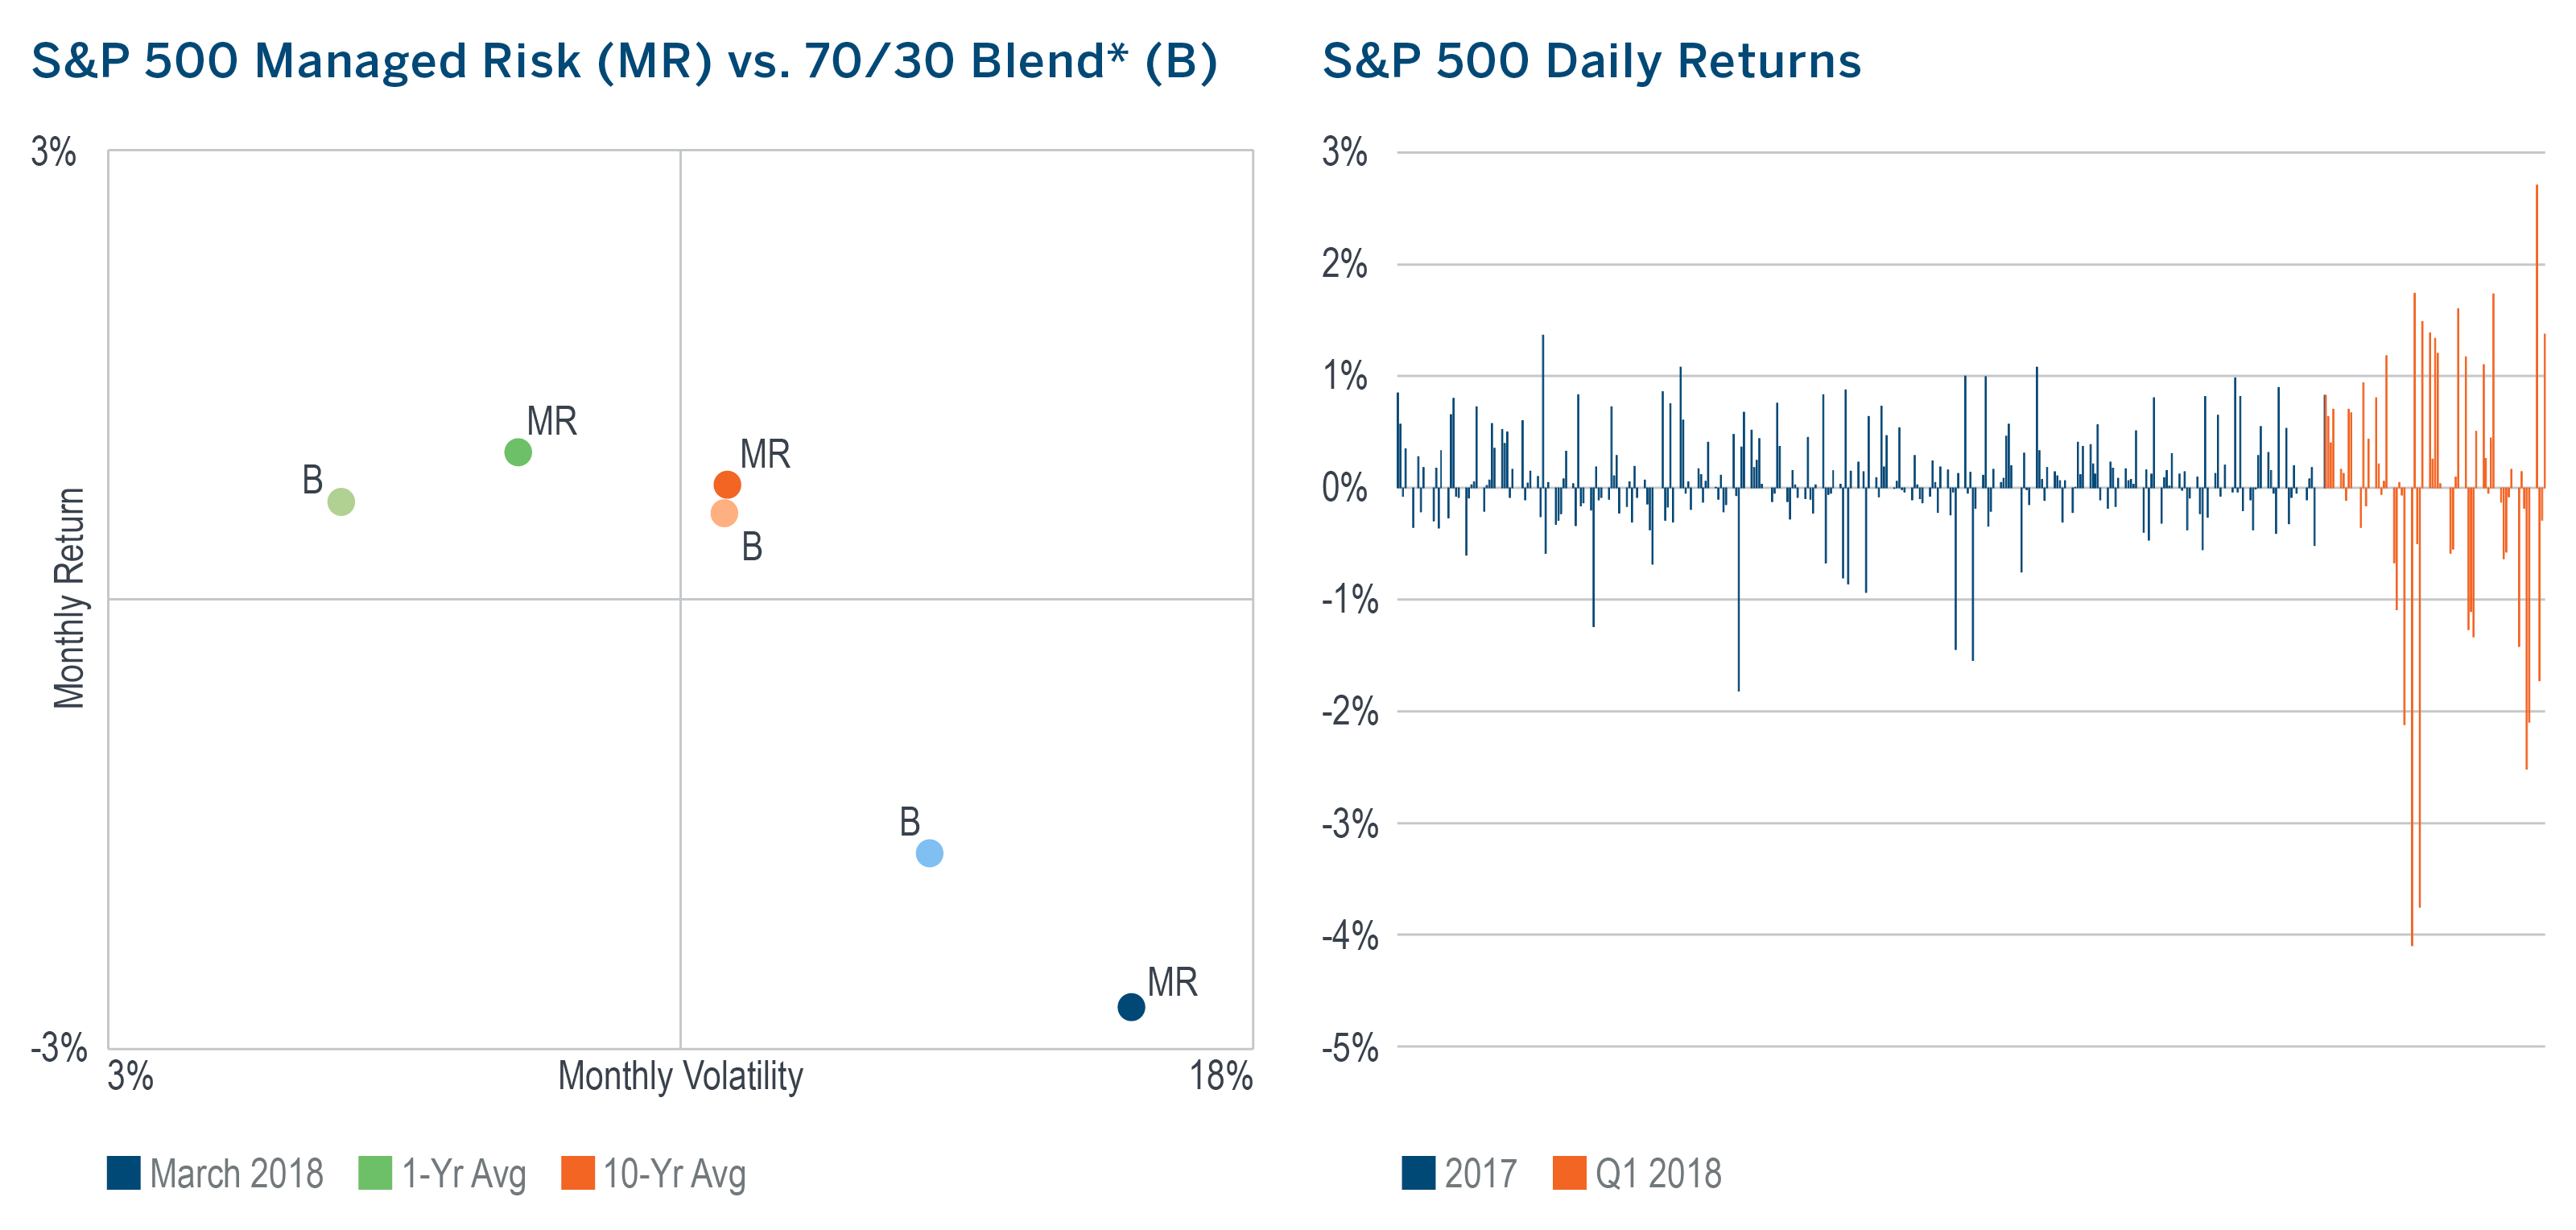
- The persistence of higher market volatility from February meant that the S&P 500 Managed Risk Index, which has an 18% vol cap and no fixed allocation to bonds, maintained a hedge position through all of March. After ending February at a 72% equity allocation, it was increased to as high as 92% before finishing the month at 67%
- Its hedge position helped to limit its participation in the downturn so that it exhibited less volatility than the S&P 500, but trailed its return by 19 bps for the month.
- Over the last 10 years, the Managed Risk Index has exhibited virtually the same average monthly volatility as a 70/30 blend*, while generating an average excess monthly return of 19 bps.
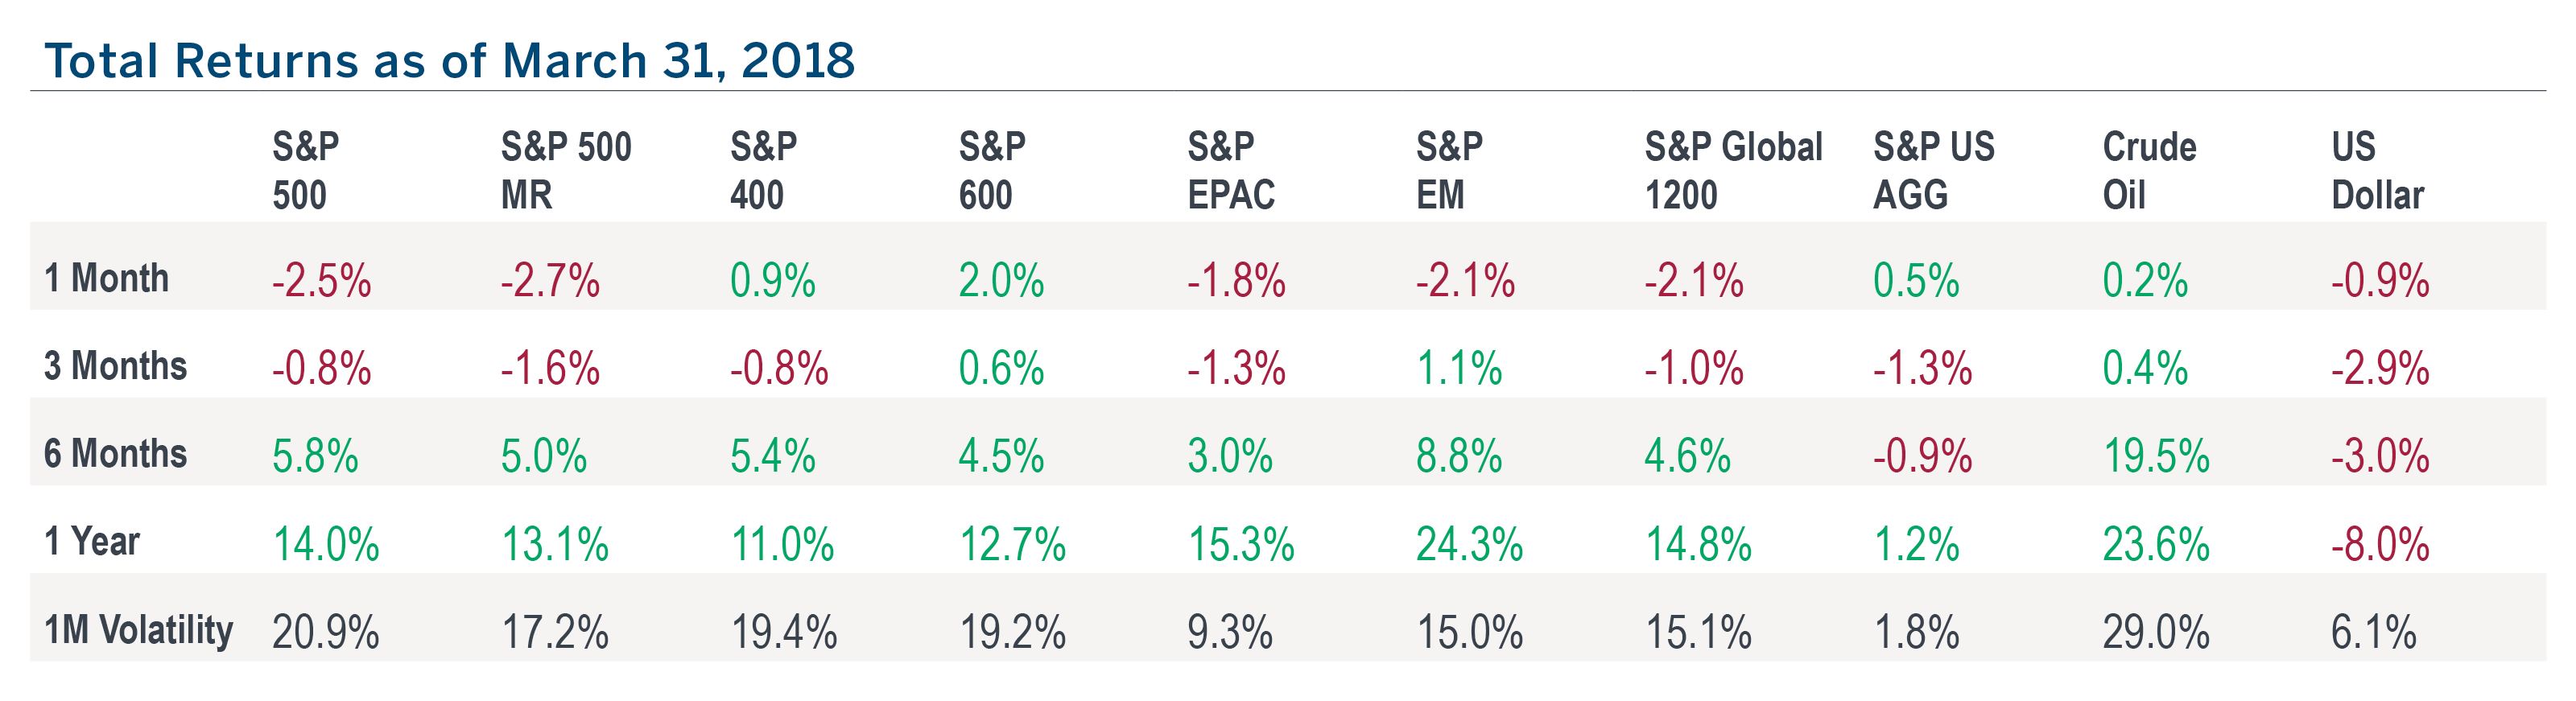
- In spite of having arguably the most hawkish central bank in the world, the U.S. dollar (as measured by the Bloomberg Dollar Index) fell 0.95% in March, leaving it 12% lower than its Jan. 3, 2017 post-crisis peak.
- Amidst a sea of red, small and mid-cap stocks were one of the few bright spots in March, likely due in part to their perceived relative advantage in the event of retaliatory tariffs.
*As measured by the S&P 500 Index and the S&P US Aggregate Bond Index.
The Strange State Of Rates
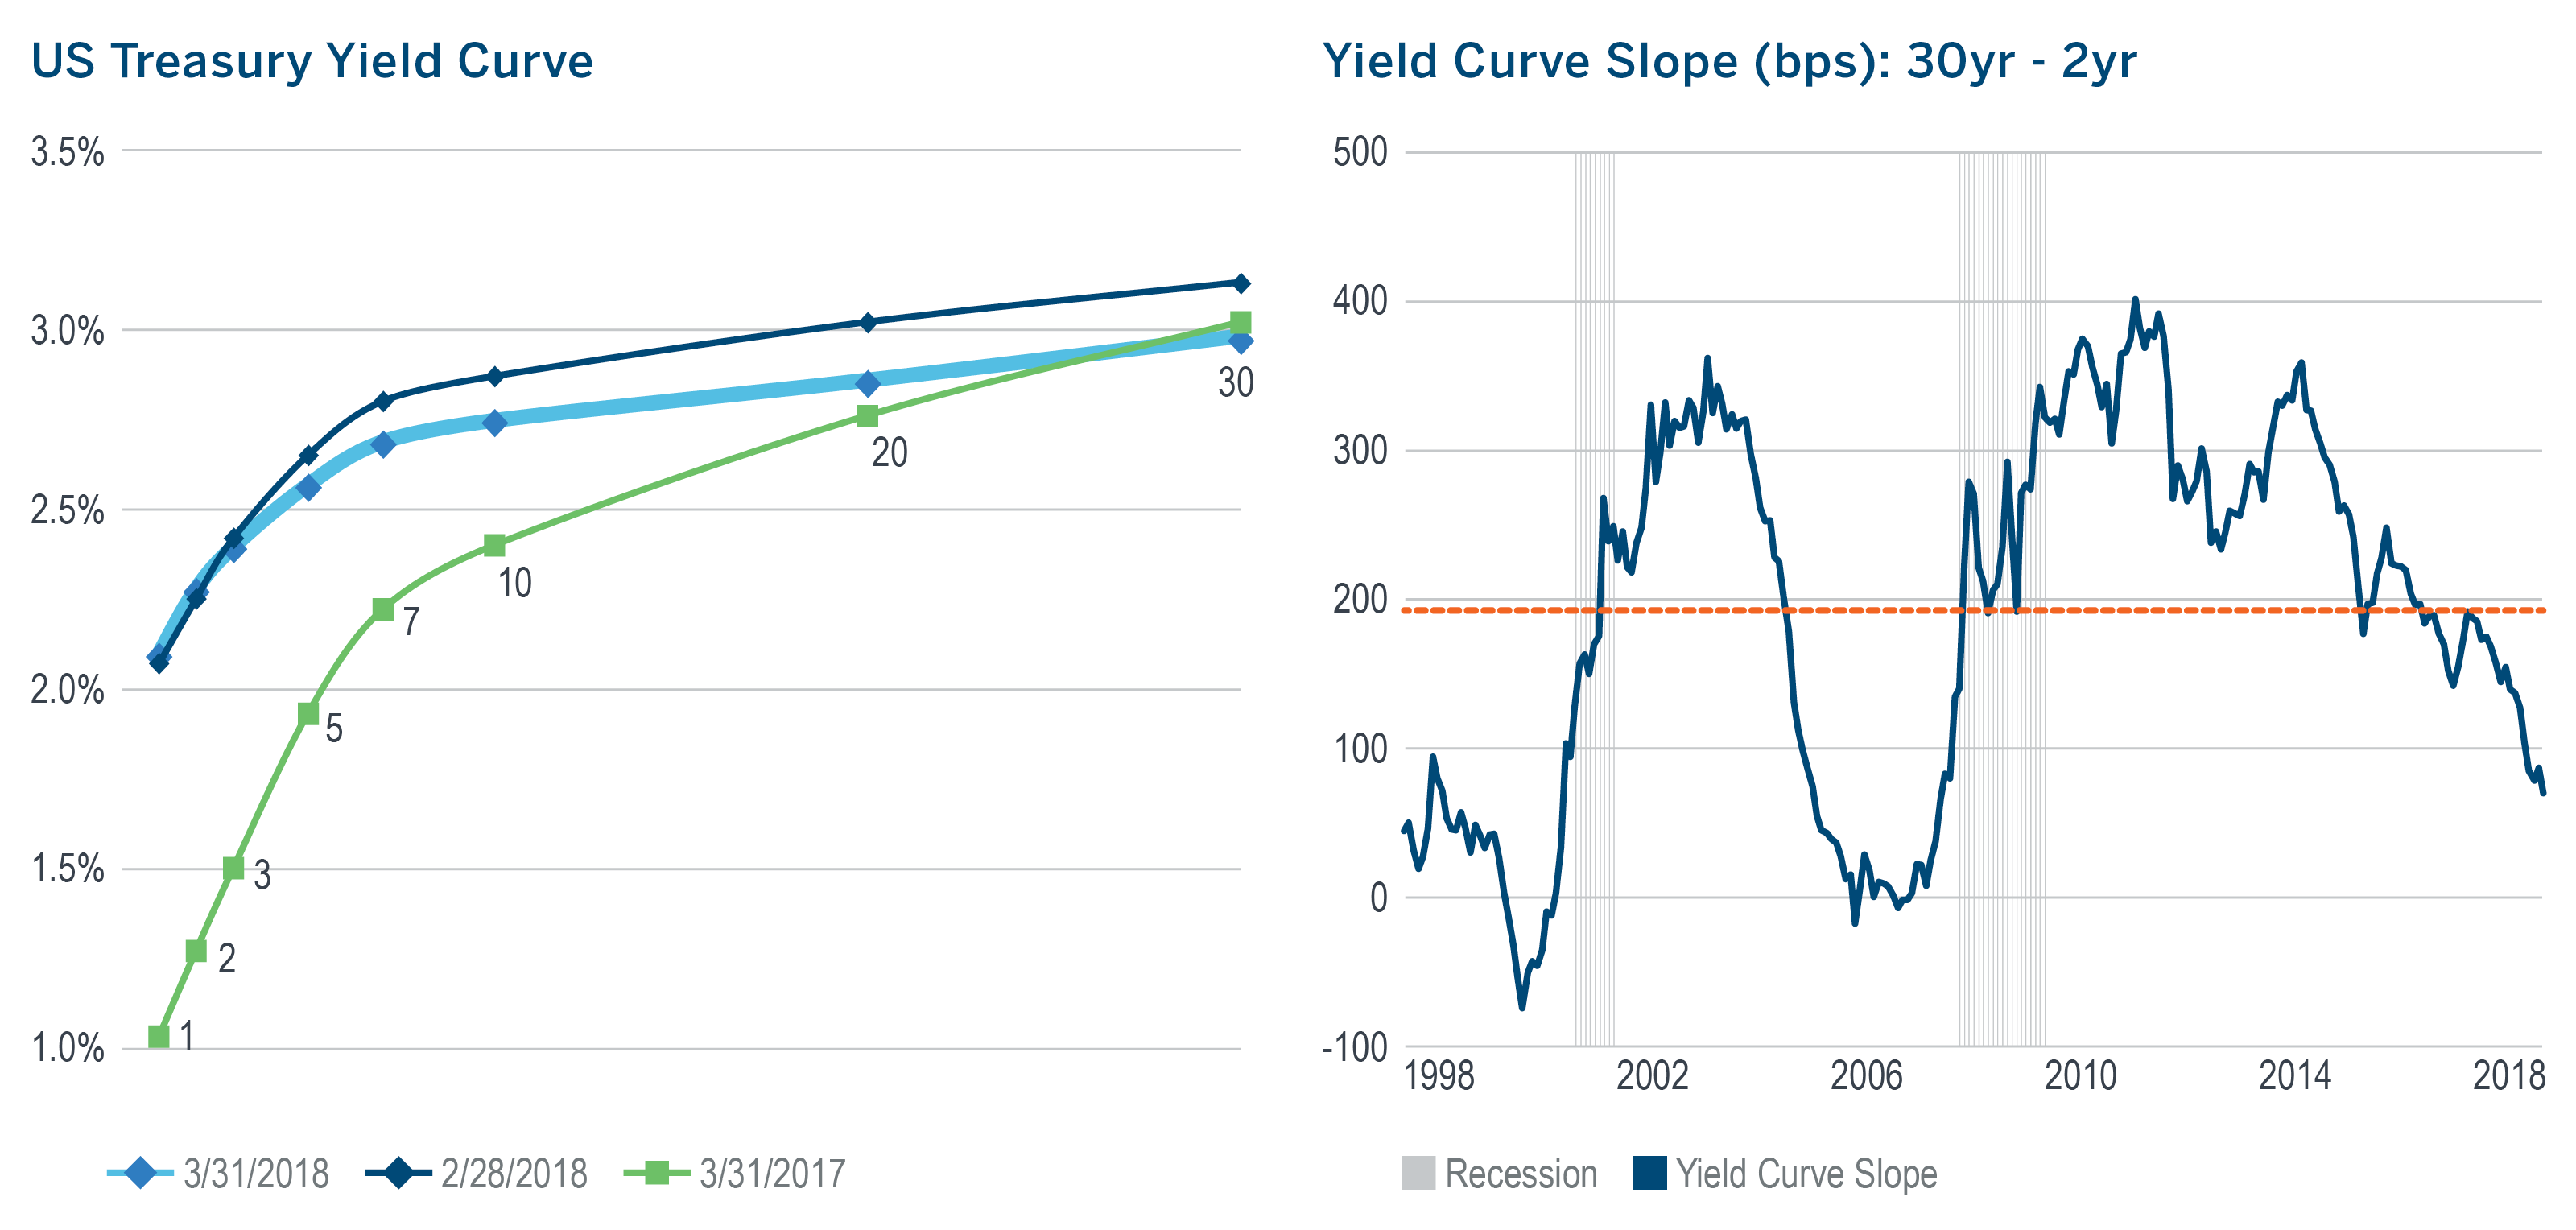
- The slope of the yield curve fell 17 bps in March, pushing it to its lowest level since September 2007 and well below its 20-year average. Its decline over the last year has been almost entirely a function of rising short-term rates.
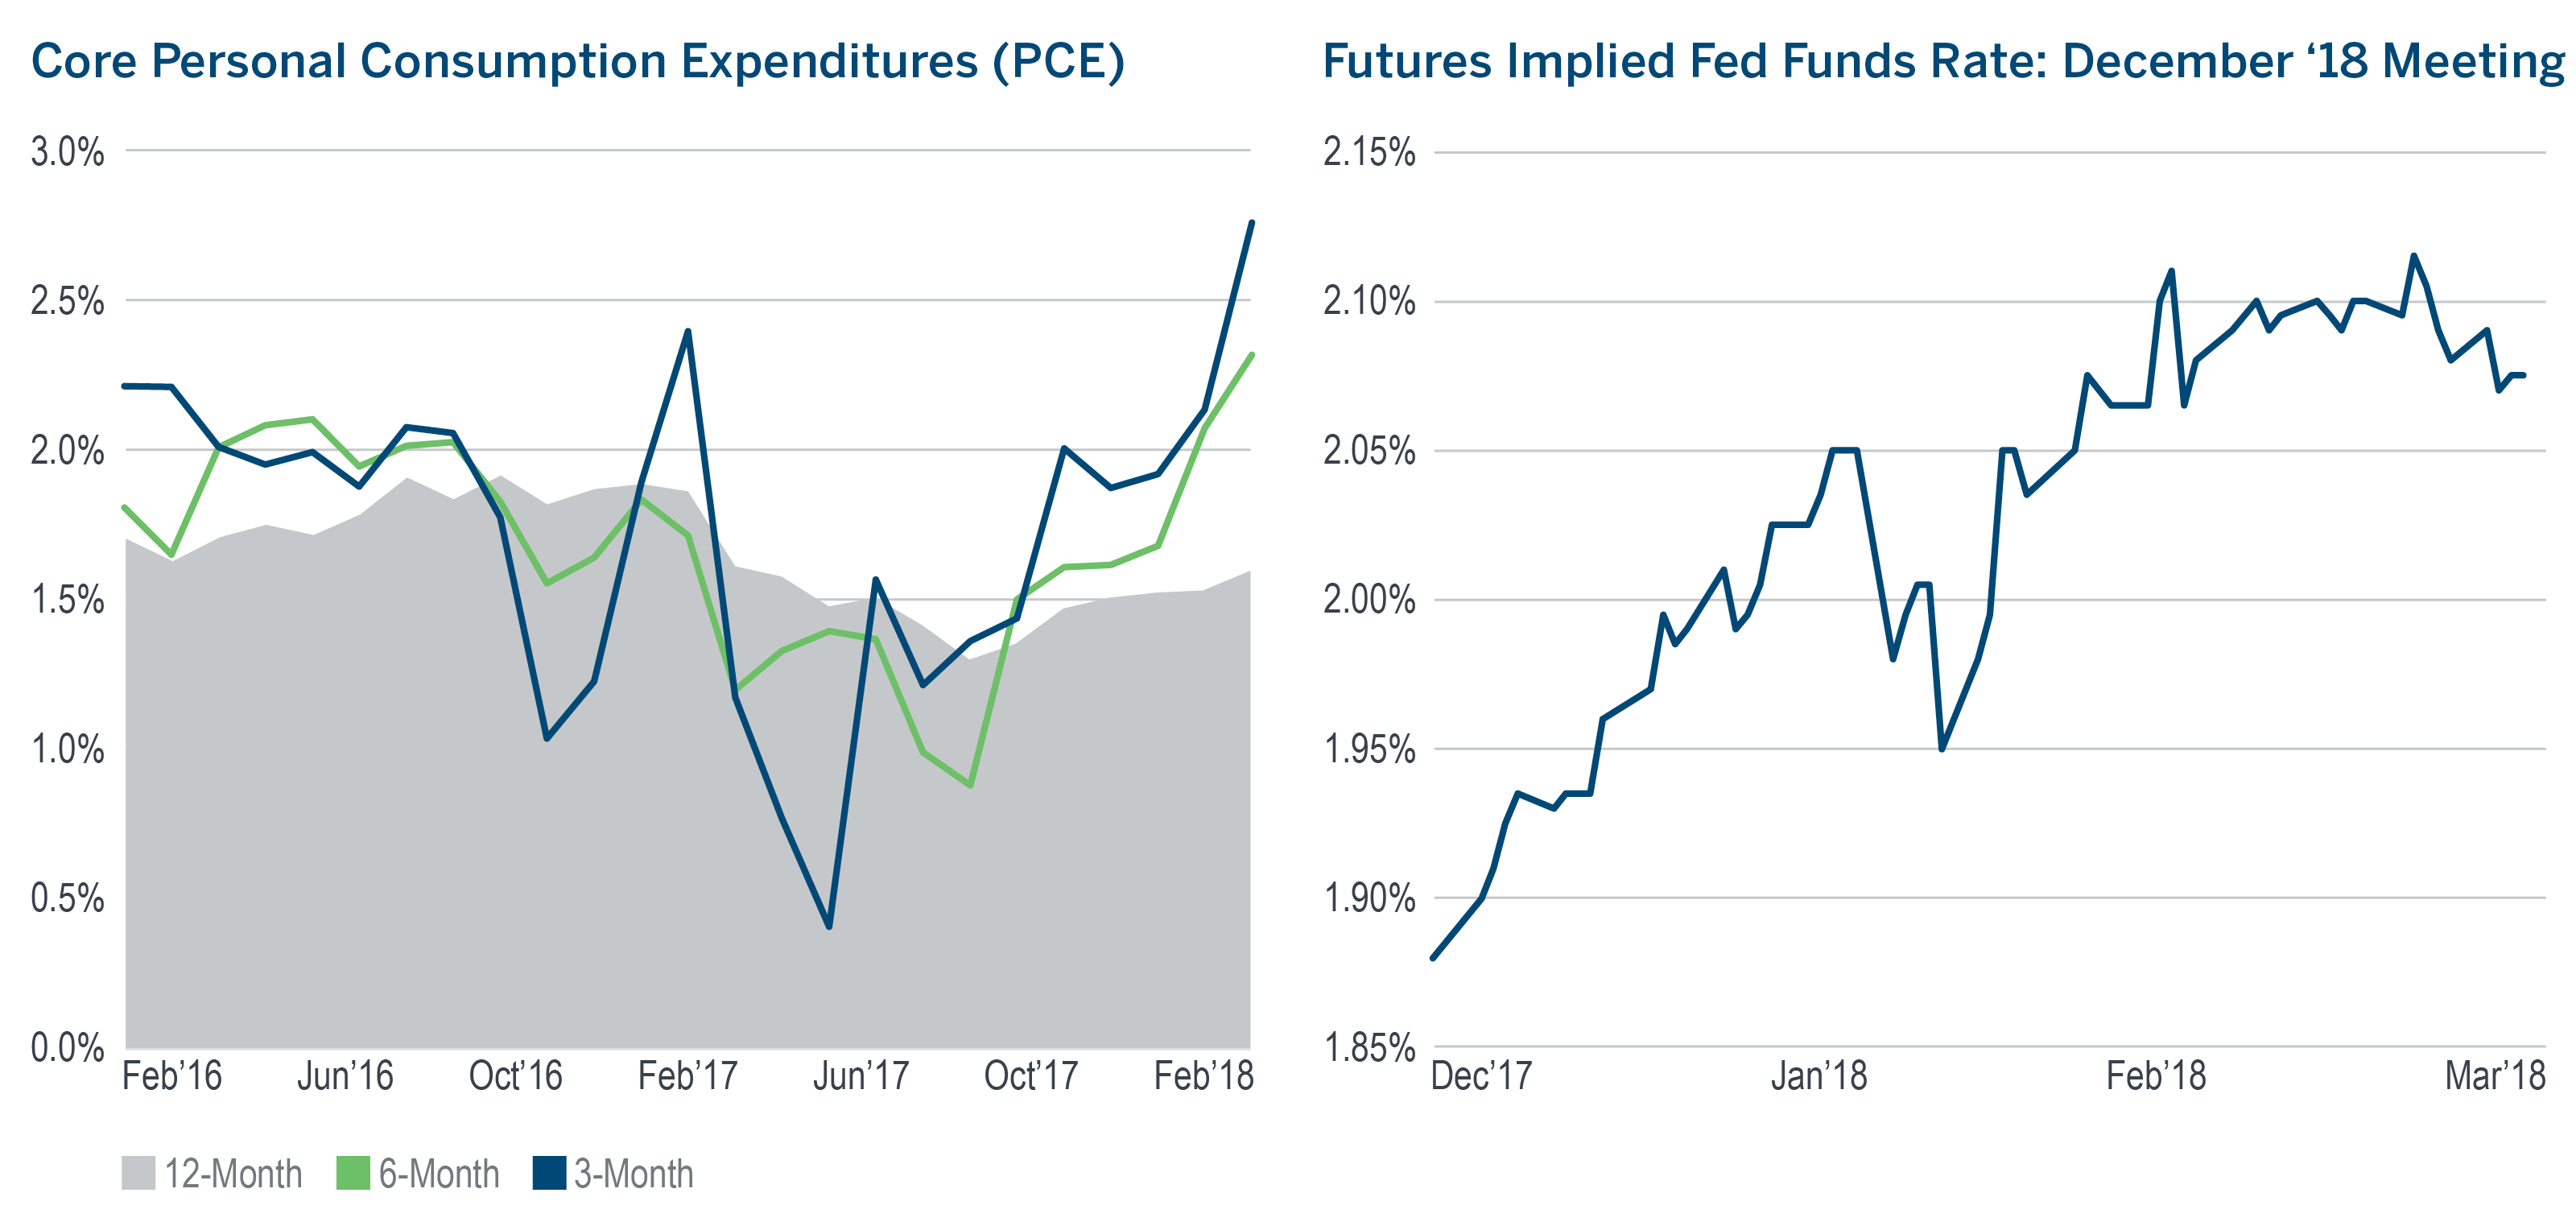
- The Fed’s March rate hike was both the first of 2018 and the first under new Fed chairman Jerome Powell. The hike pushed the fed funds rate above the year-over-year core personal consumption expenditure (PCE), the Fed’s preferred measure of inflation.
- At the end of 2017, the fed funds futures market reflected an expectation of three rate hikes by the end of 2018. With one hike now in the books, the prediction is still for two more hikes by year end, but the probability is slightly lower.
- While the most recent PCE reading saw a 12- month change of just 1.6%, the annualized 6- and 3-month changes were above the Fed’s 2% target at 2.3% and 2.8%, respectively.
- Since the end of the debt ceiling on Feb. 8, the Treasury has issued $620 billion in just seven weeks. Amidst accelerated issuance and Fed policy normalization, investors may do well to be diligent in managing portfolio risks.
Download pdf here
Recipients must make their own independent decisions regarding any strategies or securities or financial instruments mentioned herein.
The products or services described or referenced herein may not be suitable or appropriate for the recipient. Many of the products and services described or referenced herein involve significant risks, and the recipient should not make any decision or enter into any transaction unless the recipient has fully understood all such risks and has independently determined that such decisions or transactions are appropriate for the recipient.
Past performance is not indicative of future results. Index performance information is for illustrative purposes only, does not represent the performance of any actual investment or portfolio, and should not be viewed as a recommendation to buy/sell. It is not possible to invest directly in an index. Any hypothetical, backtested data illustrated herein is for illustrative purposes only, and is not representative of any investment or product.
Any discussion of risks contained herein with respect to any product or service should not be considered a disclosure of all risks or a complete discussion of the risks involved.
The recipient should not construe any of the material contained herein as investment, hedging, trading, legal, regulatory, tax, accounting or other advice. The recipient should not act on any information in this document without consulting its investment, hedging, trading, legal, regulatory, tax, accounting and other advisors.
The materials in this document represent the opinion of the authors and are not representative of the views of Milliman, Inc. Milliman does not certify the information, nor does it guarantee the accuracy and completeness of such information. Use of such information is voluntary and should not be relied upon unless an independent review of its accuracy and completeness has been performed. Materials may not be reproduced without the express consent of Milliman.
MIL_COM_1 3/18_3/19 © 2018 Milliman Financial Risk Management LLC
For financial professional use only. Not intended for public distribution. Unless otherwise noted, data is sourced from Bloomberg.


