This study is part of our efforts to test the feasibility of building an Emerging Market (EM) country rotation model. In this study, we look at how effectively our internally-developed EM stock selection model can guide country overweights/underweights. Back testing shows that stock-level factor alpha can indeed be captured at the country level. With the rapid development of single country ETFs, capturing factor alpha at the country level may prove to be an efficient, practical alternative to individual stock selection.
The Approach
This study has three distinctive features compared to our previous country rotation studies. First, in the prior studies, all factor signals were calculated at the index level, hence, when using the cap-weighted MSCI EM country index, the momentum factor signal, for example, was heavily influenced by abnormal price movement of large companies. In this study, the momentum factor is calculated at the stock level and a Z-score is applied to minimize outliers. The factor Z-scores of individual stocks are then cap weighted to generate a country-level factor signal, essentially rolling the stock level signal to the country level.
The second feature of this approach is that an array of fundamental and market factors are employed to generate a composite score for each country. Previously, we only studied single factor categories. Our EM stock selection model includes the following factor categories.
-
Valuation: Five separate valuation metrics are employed, and for each, both trailing and forecast readings are used.
-
Growth: Growth rates are computed for both top-line and bottom-line; the rate is based on trend growth, trailing, and forecasted rates.
-
Sentiment: A total of seven factors are used to gauge investor sentiment toward a particular stock (and toward a country when the score is rolled up at the country level).
-
Quality: Several measures are used to rank company profitability; Quality factors are also used for the ranking within this factor category.
-
Price-based: This includes Momentum and Risk readings based on stock volatility.
Each factor category is assigned a proprietary weighting, and a composite score/country ranking is calculated by rolling up the Z-score of each to the country level.
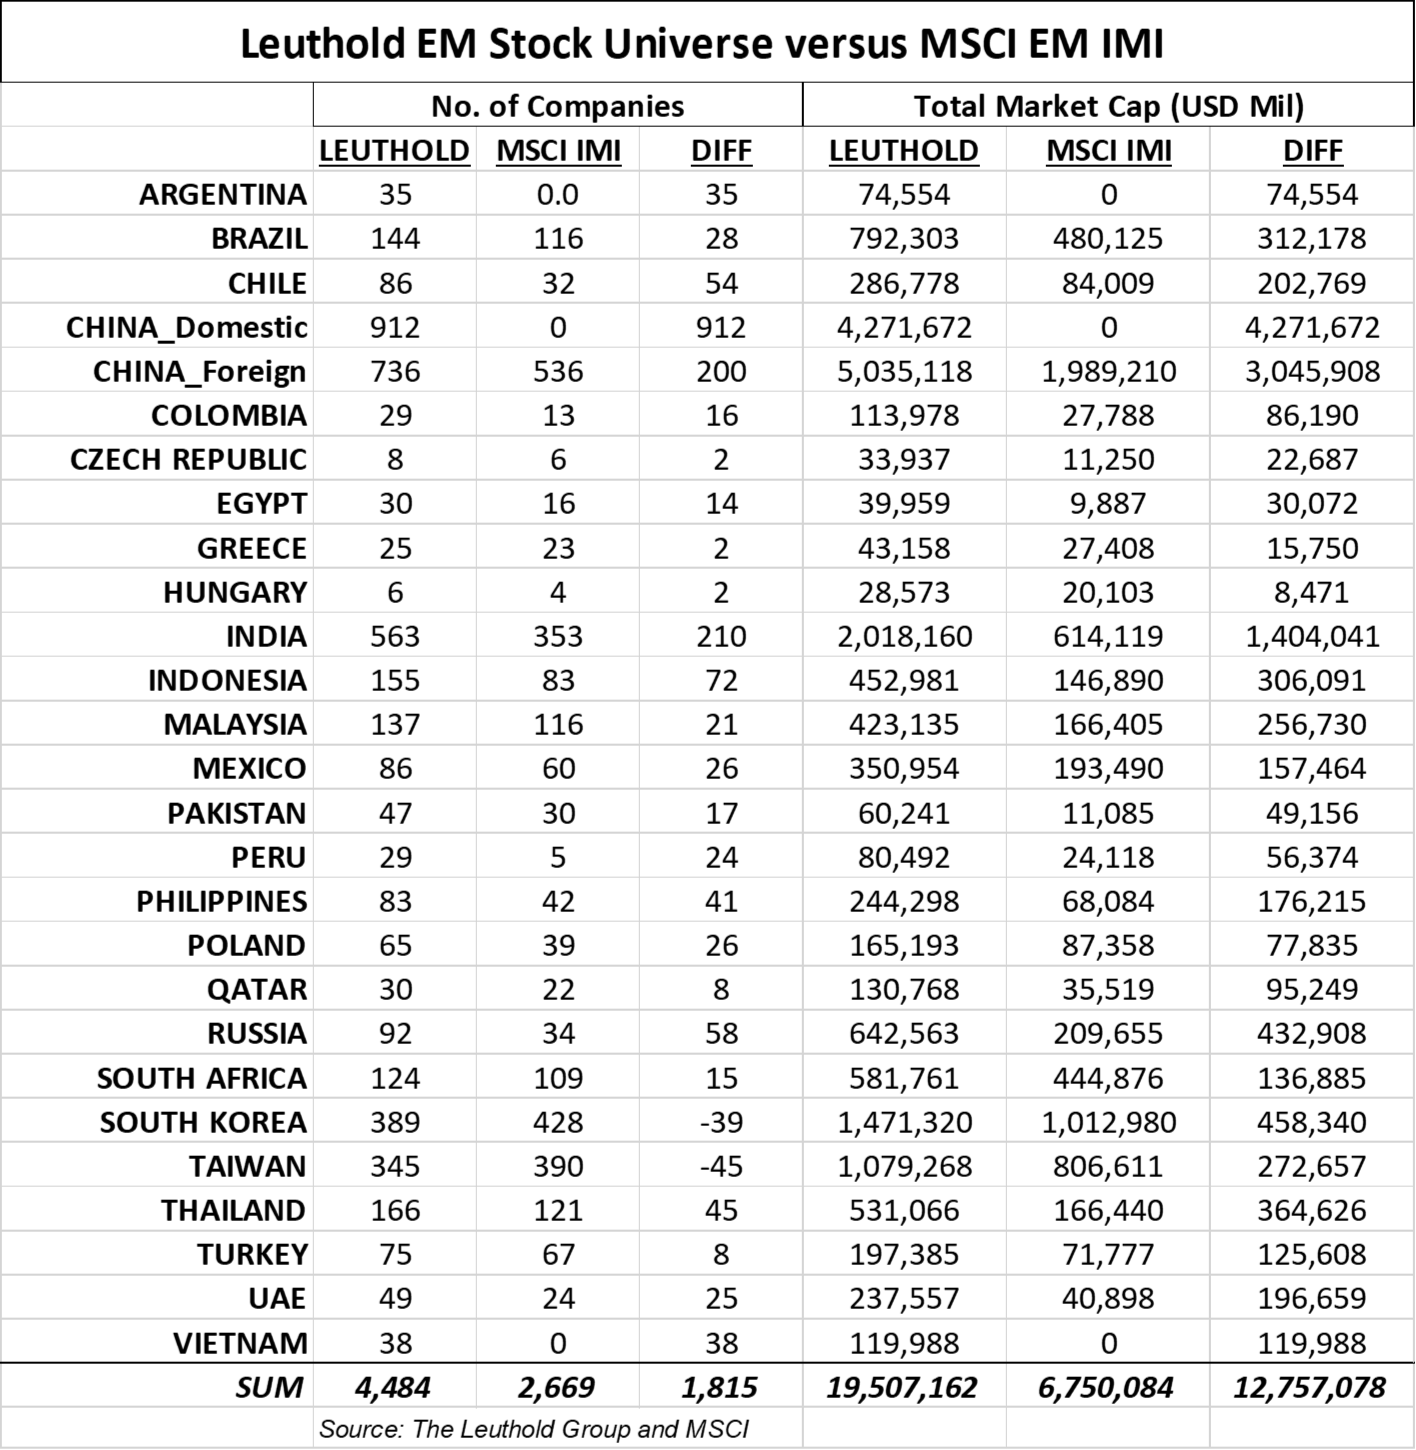
The third feature of this approach is that factor signals are based on a much broader stock universe. Leuthold EM stock universe covers more than 4,000 stocks, versus 2,600 and 800 stocks underlying MSIC EM IMI and MSCI EM Index, respectively. In our opinion, aggregate factor readings across a broader stock universe could better capture the country effect. In addition, we applied this model to 27 EM countries/markets, including two frontier countries (Argentina and Vietnam), and we split China into foreign market and domestic market.
Leuthold EM Country Index Back-Test Outcome
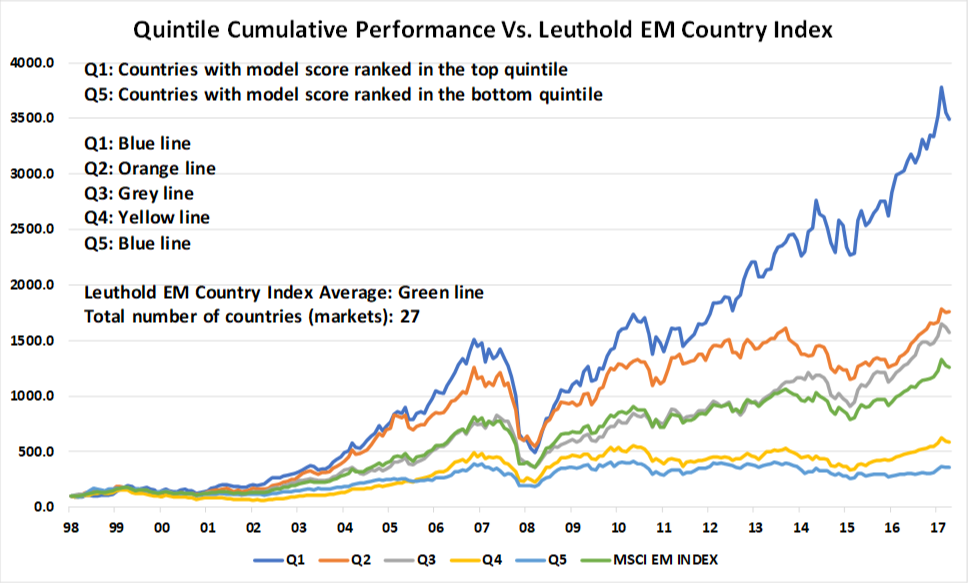
Good performance spreads between the top and bottom quintile countries and between quintile 1 (Q1) and the benchmark.

We ranked the 27 EM countries/markets into five quintiles based on the country-level composite scores. Each quintile was rebalanced monthly, with the cumulative return index shown in Charts 1 and 2 (December 1998 to March 2018, equal-weighted country quintiles). The quintiles in Chart 1 are benchmarked against the MSCI EM Index, whereas in Chart 2 the comparator is the Leuthold EM Country Average. Both charts show that quintile 1 countries significantly outperformed those ranked in the other quintiles. The extent of this outperformance is quite striking. Quintiles 2 and 3 also significantly outperformed the MSCI EM Index, and to a lesser extent, outperformed the Leuthold EM Country Index Average. On the other end, countries in Q5 underperformed all other quintiles and both benchmarks.
Table 1 compares annualized returns, as well as the Sharpe Ratio based on monthly performance for the five quintiles versus the four indices. For the back testing period, Q1 outperformed, both on a total return and risk-adjusted return basis. On an annualized basis, Q1 countries returned +20.1%, significantly outpacing countries in the bottom quintile. All top quintile countries also outperformed the cap-weighted indexes (MSCI EM Index and MSCI EM IMI), as well as the equal-weighted indexes (MSCI Country average and Leuthold Country average). On a risk-adjusted basis, Sharpe Ratios of Q1-Q3 countries are all above benchmarks, while Q5 countries have a much lower Sharpe Ratio.
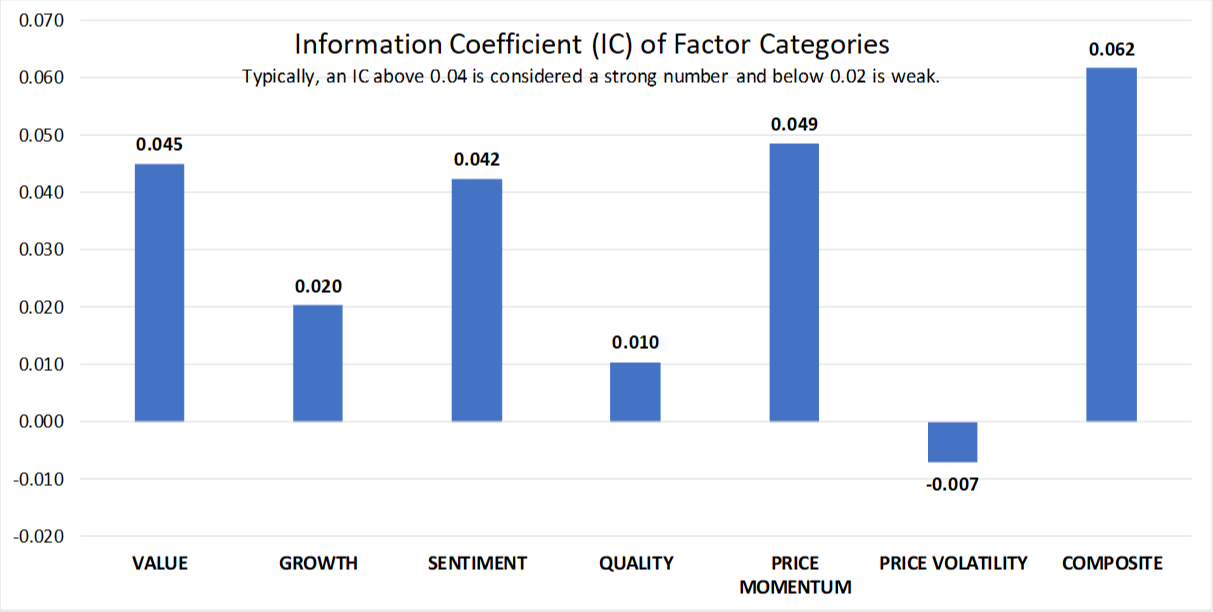
Best performing factor categories: Momentum, Value, Sentiment
The Information Coefficient (IC, Chart 3) shows that both price Momentum and Value factor categories have the highest predicting power. Note that when we used country index Momentum readings as signal input (see EM country rotation study, September 2017), the Momentum factor tended to perform quite poorly. However, in this analysis, when the aggregate Momentum signal (based on the broader stock universe) was rolled up to the country level, this factor turned out to be the best signal. One explanation is that the approach used in this study captures broader Momentum, which may be more persistent (higher-momentum countries based on this measure continued to outperform).
The good predictive power of Value factors is in agreement with what we found using index level factor signals. Quality and risk (approximated by Price Volatility) are both showing significantly lower IC or negative IC, indicating poor predictive power. It seems that company quality and price stability are not being sought after by EM investors. Q1 and Q5 return spreads are actually negative within these two factor categories. Finally, and most importantly, IC of the composite score is the highest, an outcome of diversifying among factor categories with lower correlation.
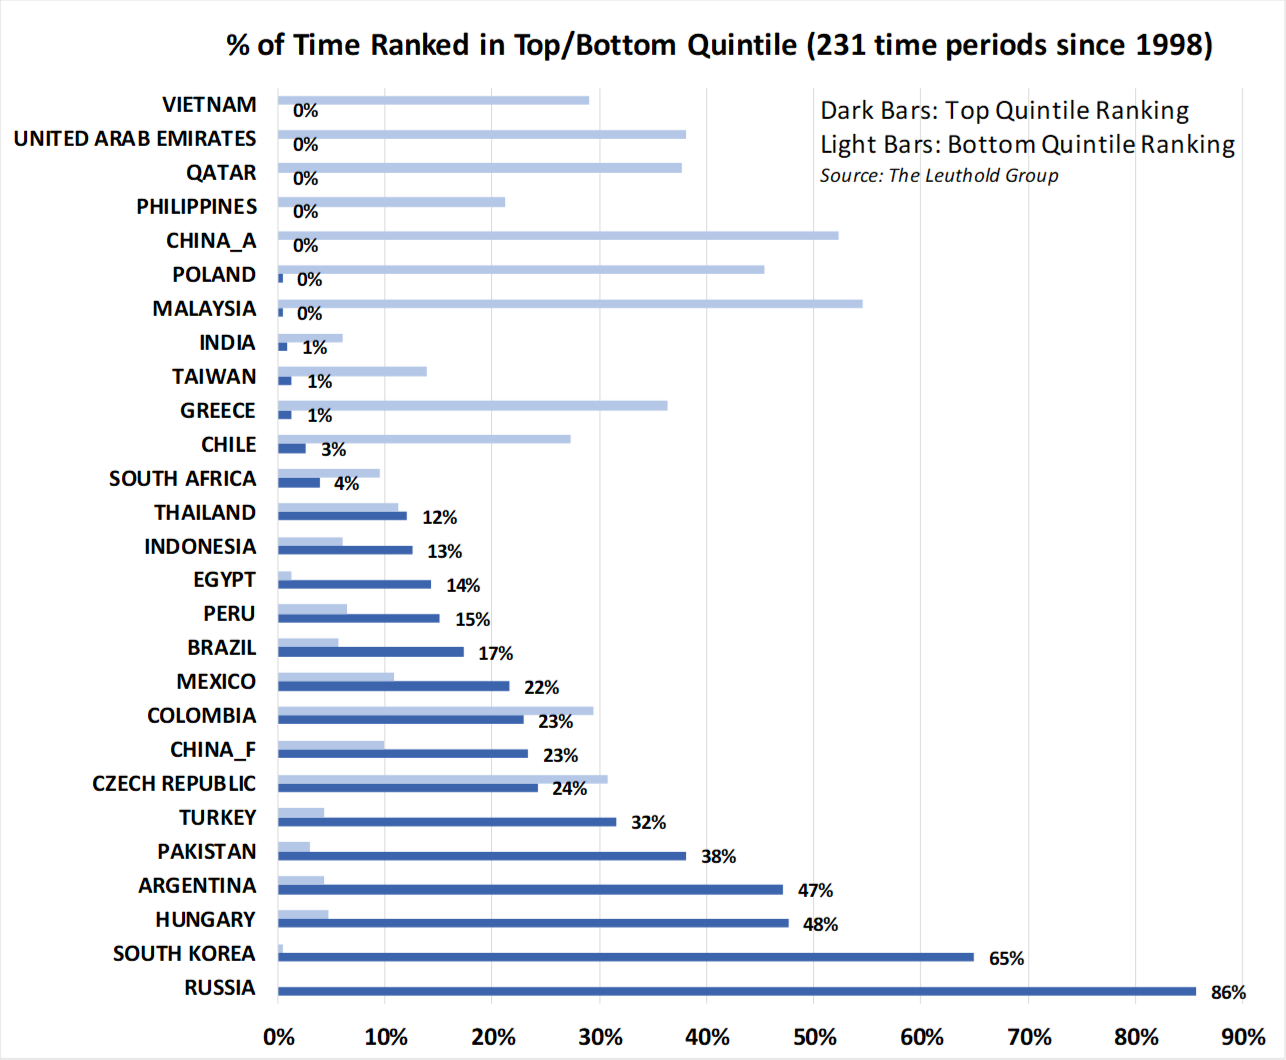
Country rankings tend to be persistent in the top/bottom quintiles.
We next looked into the persistence of model output. Chart 4 shows that, generally, this model tends to favor certain countries over others. For example, Russia is ranked in the top quintile 86% of the time, while South Korea ranked in Q1 65% of the time. Some other countries that tend to have higher rankings are Pakistan, Argentina, and Hungary. On the other side of the spectrum, Malaysia, China domestic market (A-shares), and Poland are apt to rank in the bottom.
Persistent country rankings tend to reduce transaction costs when country ETFs are used to implement the model. But, the downside is that it could increase country specific risks, especially those that are not captured by this quant model.
Back-Test Outcome Using MSCI EM IMI
It is important to point out that the model under study is based on the much broader Leuthold EM stock universe than the MSCI EM IMI stock universe (see Table 2 for comparisons). The broader coverage results in a model that better captures country leadership, but it could sacrifice on the portfolio implementation side. Since the country performance index we compiled is not investable, we next tested the model signals using MSCI EM IMI, an index which is investable through country ETFs.
Table 3 shows the quintile return spread using MSCI EM IMI as return sources. The results show the spread between Q1 and Q5 are comparable, but the advantage of Q1, versus Q2 and Q3, as well as Q1 versus the benchmark, are reduced to some extent. Sharpe Ratios are reduced for all five quintile countries. This back testing, however, proves that it is feasible to capture the factor premium using ETFs tracking the MSCI EM IMI.
Implementation: Caveats
1) ETF Management Fees and Transaction Costs
So far we’ve shown that factor premium can be captured at the MSCI EM IMI country level. However, in practice, investment vehicles for this strategy are individual EM country ETFs. We find it hard to back test (or do portfolio simulation) using those ETFs as most of them have a short trading history. And, keep in mind that the expense of ETFs could certainly detract from model performance. In addition, transaction costs, even though much lower than individual EM stocks, add another source of slippage. Appendix 1 shows the largest country ETFs among EM countries, and their corresponding expense ratios. Note that two countries (Hungary and Czech Republic) do not have investable ETFs as of now.
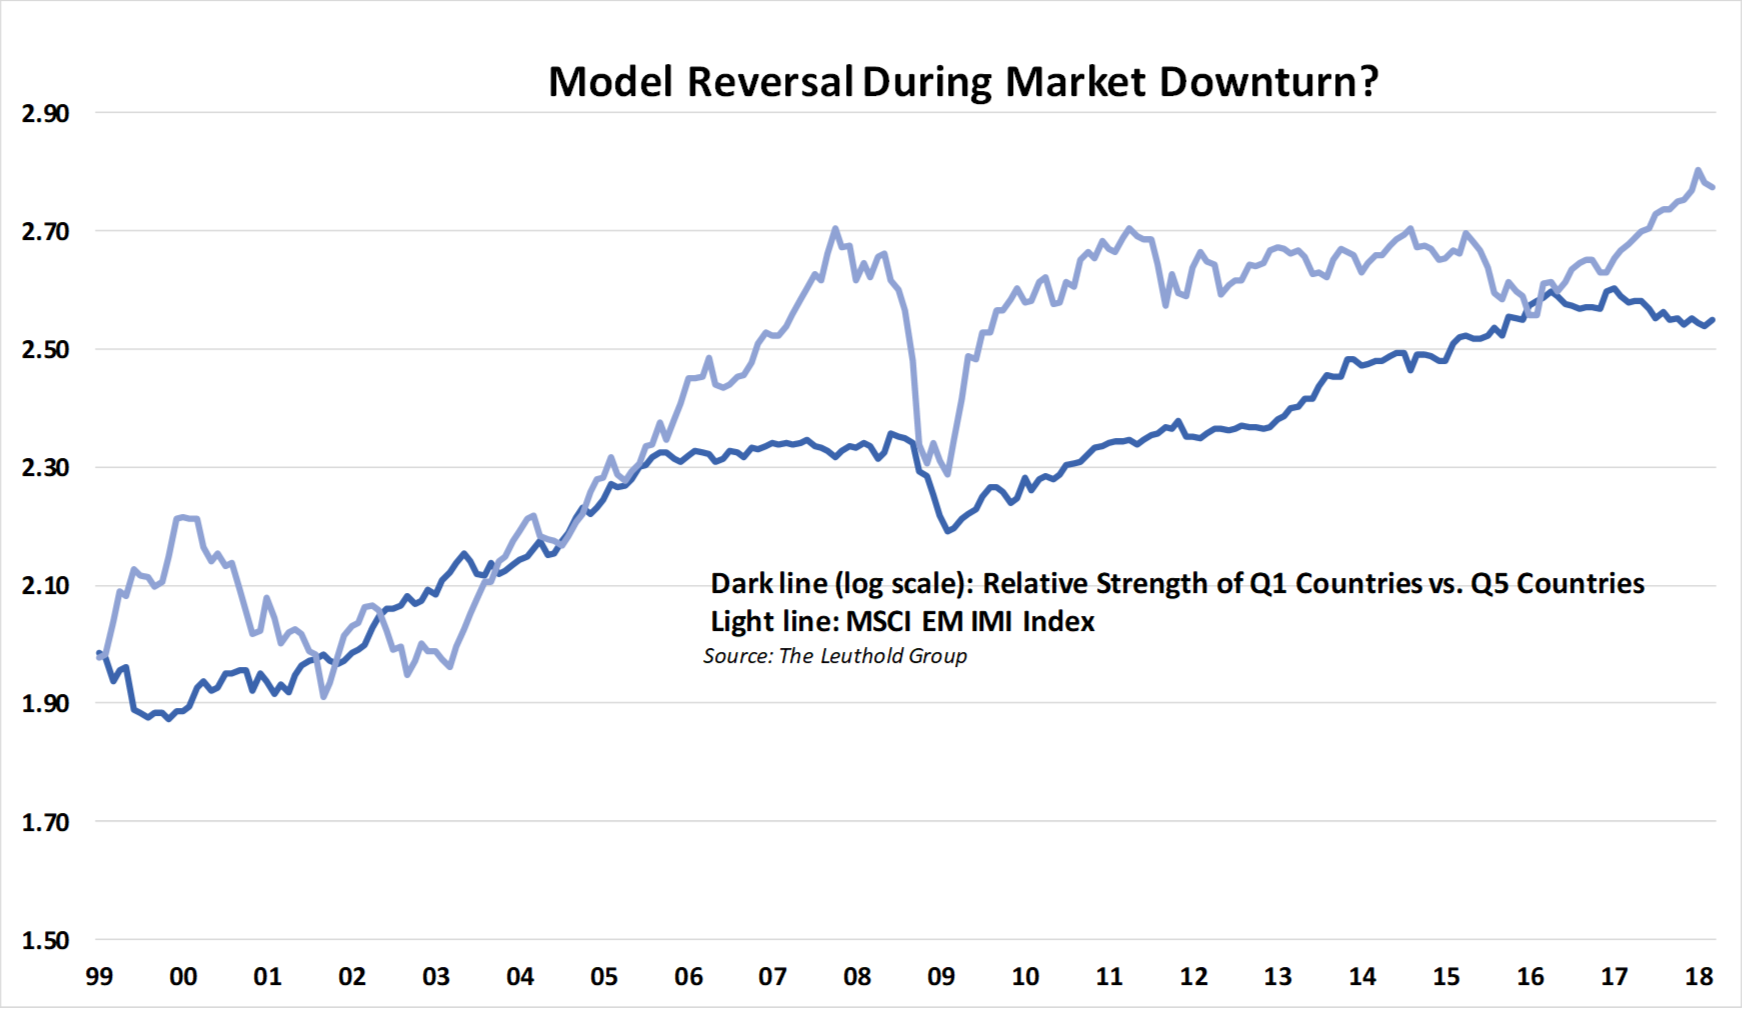
2) Model Reversal During 2008-2009 —A Precaution?
Due to lack of historical data, we could not test our model over multiple market phases. However, Chart 5 shows the model reversal during the 2008-2009 market crash. Relative performance of top ranked countries versus bottom ranked countries declined (dark line), together with the MSCI EM IMI (light line).
A Momentum reversal could be part of the explanation as quintile 1 countries outperformed leading up to the 2008-2009 market crisis. If that history repeats, one has to pay attention to the long streak of quintile 1 country outperformance from 2009 to early 2017. If there is a crack in the overall market, we might see another model reversal like what happened in 2008.
Appendix: Current Country Ranking And Largest EM Country ETFs
© 2018 The Leuthold Group
www.leutholdfunds.com
Read more commentaries by The Leuthold Group