I am often asked by prospects whether financial advisors add value? Being one, of course, I believe we add a great deal of value for our clients, in helping set and implement long-term financial goals, reviewing insurances and risk management strategies, being tax-efficient in all aspects of investing and estate/gift transfer issues, helping with education funding strategies, attempting to constantly reduce portfolio expenses, and much more.
But in many cases, and especially when the markets become increasingly unpredictable, our most valuable advice may simply be encouraging clients to follow good investment practices. This means keeping them from getting too swayed by momentary urges and making dramatic portfolio changes, usually based upon emotion (i.e. greed and fear), that they may regret later. Basically, our goal is to remove emotion and inject a bit of common sense when needed.
One of the foundational concepts that tries to quantify common sense is Modern Portfolio Theory (MPT), first discussed by Harry Markowitz when he was a doctoral candidate at the University of Chicago in 1952 (as an aside, I’m not sure how far we need to get from 1952 before we cannot continue to call something “modern”). MPT takes the dynamics of individual portfolio decisions (e.g. how much in stocks, bonds, etc.) and generates a continuum of investment options based on risk-tolerance. Typically called the “efficient frontier,” the continuum offers up portfolio allocations that aim to maximize expected return given a level of risk or, putting it another way, the lowest possible risk for a given level of return.MPT evolved and eventually engulfed other theorems, including the Efficient Market Hypothesis, which essentially translates into: markets reflect all information, trade at fair value, and the aggregate participants are rational.
Putting these together creates the following building blocks:
• Investors are rational.
• Markets are efficient.
• Investors must take on more risk to generate more return.
• Diversification (the use of uncorrelated or less correlated assets) reduces the risk of the overall portfolio.
• Investors should build portfolios according to mean-variance theory.
Now, although a lot of that is true over extended periods of time, MPT tends to break down in the shorter-term and becomes (as described by our Chief Investment Officer, Dmitriy Katsnelson) “Modern Portfolio Reality” in which:
• Investors are not rational but could be considered “normal” (the definition of which is way beyond the scope of this missive).
• Markets are not perfectly efficient.
• Investors take on risk in the hopes of greater returns in areas not supported by fundamentals (e.g.cryptocurrencies, Beanie Babies, etc.).
• Diversification breaks down when systematic risk alters correlations.
• Investors design portfolios on the rules of behavioral theory.
This dichotomy has led to the increased study of what is called “behavioral finance”. Behavioral finance attempts to explain and increase our understanding of the emotions and reasoning patterns of investors (and markets) in decision making. It tries to overlay the human element on investment and financial decisions.
Arnold Wood, founder and former President & CEO at Martingale Asset Management described behavioral finance as follows:
“It is the study of us. After all, we are human, and we are not always rational in the way equilibrium models would like us to be. Rather we play games that indulge self-interest. Financial markets are a real game, they are the arena of fear and greed. Our apprehensions and aspirations are acted out every day in the marketplace. So, perhaps, prices are not always rational, and efficiency may be a textbook hoax.”
Research in psychology has documented a range of decision-making behaviors called biases. These biases can affect all types of decision-making but have particular implications in money and investing. The most common of these biases are:
• Overconfidence - Overconfident investors tend to overestimate their ability to identify successful investments. Feeling that they control more of the performance of an investment than they do, this could lead to a lack of proper diversification and/or excessive trading. Overconfidence may be fueled by another characteristic known as “Self-Attribution Bias.” This means that individuals faced with a positive outcome following an investment decision consider it a reflection of their ability and skill, while a negative outcome is attributed to bad luck or misfortune.
• Loss Aversion - In general, investors are more sensitive to loss than to gain, in some research by a ratio of 2:1. Loss aversion occasionally leads to the “Sunk Cost Fallacy.” An example is whenpeople try to avoid locking in a loss, instead, holding onto an investment hoping the price rises to at least “break-even.” By doing so, they do not have to admit they made an investment mistake.
• Inertia (or Regret Avoidance) - Emotions can often sway investors from acting, even if they have committed to do so. The human desire to avoid regret drives this behavior, usually leading to the most convenient path, which is “wait and see,” and often inactivity (fear). We sometimes see this effect with clients that do not want to rebalance after a portion of their portfolio has done particularly well or poorly.
• Framing - The way that something is presented (i.e. highlighting positive or negative aspects) translates to a different response even when the outcome is the same. One example of this isdisplaying beef that is 95% lean or 5% fat. Finance theory suggests we consider our portfolio in the aggregate, nevertheless, the eye often falls on individual investments. The focus is on the 5% fat. This narrowness tends to increase investor sensitivity to loss as compared to those individuals that are more comprehensive in their review.
• Home Bias - Investors have been documented to prefer investing in familiar/home country assets, associating familiarity with lower risk. This could lead to lack of proper diversification.
• Recency Bias - Investors more prominently recall and emphasize recent events/performance over those in the near and distant past, assuming the current trend will continue.
• Anchoring/Conservatism Bias - This is the tendency for investors to rely too heavily on an initial piece of information, despite new and/or contradictory information.
• Herd Behavior - This is purchasing investments based on price momentum while ignoring basic economic principles. Does Bitcoin ring a bell?
Behavioral finance is all about trying to understand biases in human behavior when it comes to money, and as advisors, part of our role is to identify potential behavioral missteps that can disrupt long-term planning.
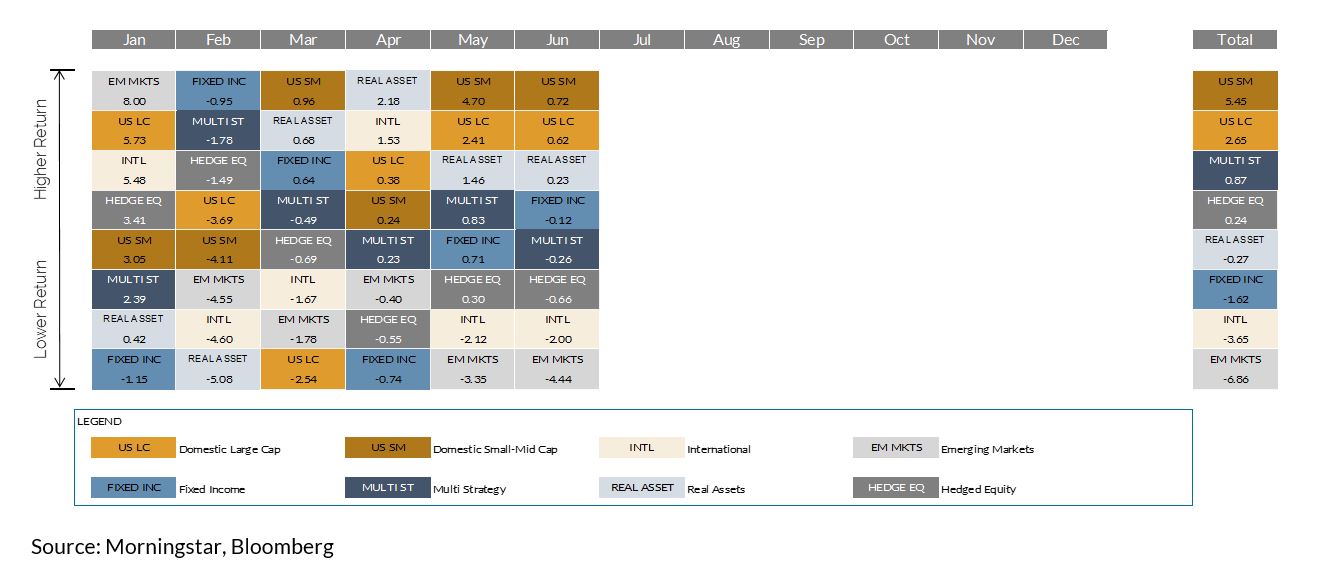
Markets – Trade and Rhetoric

Source: Morningstar, Bloomberg
Trade and rhetoric dominated headlines during the quarter, washing away any good taste the strong Q1 earnings season may have left behind. Whether supported by true fundamentals or not, this undercurrent was used to explain many a market movement. Small-mid cap stocks rallied strongly in April and May.The explanation used? Less exposure to overseas sales than their large cap counterparts and more focus domestically should insulate the companies from a trade fight. Some small cap industrials and materials companies would beg to differ (mostly down for the year). Within the small-mid space almost 70% of the year-to-date return has come from technology and health care stocks. Both of those sectors are “growth” style stalwarts, helping growth top value yet again. Within large cap, the story is even more concentrated.Eighty percent of the return is attributable to four stocks – Amazon, Microsoft, Apple, and Netflix.Growth is again rewarded.
International and emerging markets, in particular, struggled during the quarter. Trade and a stronger U.S.dollar were often highlighted as the culprits. The dollar’s year-to-date strength (a reversal of 2017 weakness) drove half of the underperformance relative to U.S. stocks. Much of the other half came frompoor performance in international financials.
The Fed came in with another rate hike in June, and current expectations are for another 1-2 hikes by year end. This activity has put additional pressure on term premiums (i.e. how much more longer-dated bonds yield than shorter-dated issues). Historically a floundering term premium is a precursor to economic slowdowns, something the Fed themselves highlighted in recent minutes. Municipal bonds (represented by the Barclays Muni 1-10 Year Index) bucked the trend with a strong second quarter. Municipal bond issuance is down nearly 20% from the same period last year, highlighting reduced supply.
Within the alternative space there was a strong rebound in dividend-heavy real assets and flattish returns elsewhere. Global REITs and infrastructure showed resilience (both up more than 3% in Q2) after a very tough start to the year. Commodities posted a flat quarter as strong returns out of energy commodities (oil up more than 13%) offset weakness in metals and agriculture. Trade-laden soybeans (a major U.S. export) were amongst the most volatile, falling more than 18% in Q2. Multi-strategy funds (represented by the HFRI FoF Diversified Index) rose 0.8% for the quarter. Hedged equity funds (represented by the HFRX Equity Hedge Index) fell 0.9%, with growth-oriented funds topping value.
Final Thought
A Tale of Two Economies (Framing Example) - The first economy is one where the unemployment rate has fallen by more than 50% since 2009, where real GDP growth is annualizing more than 2.2% over the same period, and where publicly traded companies have reduced their debt relative to earnings (using debt/EBITDA) by more than 50%.
The second shows an employment rate that is still below where it was in 2009, where real GDP numbers have been flat to negative over that period, and where corporate debt burden has never been higher.
Which one would you prefer? Both are pictures of the United States, viewed through different goggles over the same period. Both sets of statements are true. The U.S. unemployment rate is below 4% compared to north of 10% in 2009, however at 61%, the employee to population ratio is pretty much back where it was in 2009. We will not get into the vagaries of how the unemployment rate is calculated, but for those interested the Bureau of Labor Statistics has reams of explanations. The second is the GDP claim. The headline numbers reflect an inflation adjustment, which in the U.S. is the PCE deflator (not even CPI). PCE has averaged 1-2% over that period, helping real GDP growth rise well above the 2009 level. On the flip side, if we were to use the original inflation basket that was put together before it was changed multiple times over the years, you would show real GDP (GDP adjusted for inflation) has been negative since 2002. Lastly, the debt question. It is true that during the recovery, earnings growth has outpaced debt issuance by a wide margin. Nevertheless, overall the corporate debt burden is now higher than what it was in 2007. In short, framing is always in play.
Bronfman E.L. Rothschild, LP is a registered investment advisor (dba Bronfman Rothschild). Securities, when offered, are offered through an affiliate, Bronfman E.L. Rothschild Capital, LLC (dba BELR Capital, LLC), member FINRA/SIPC.
This information should not be construed as a recommendation, offer to sell, or solicitation of an offer to buy a particular securityor investment strategy. The commentary provided is for informational purposes only and should not be relied upon for accounting, legal, or tax advice. While the information is deemed reliable, Bronfman Rothschild cannot guarantee its accuracy, completeness, or suitability for any purpose, and makes no warranties with regard to the results to be obtained from its use. Past performance does not guarantee future results.
© 2018 Bronfman Rothschild
www.belr.com | 888.303.2357
Read more commentaries by Bronfman E.L. Rothschild