“A man with one watch knows what time it is, a man with two watches can never be sure.”
The Wall Street community has spent the better part of thirty years finding new ways to exclude unusual items, write-offs, non-recurring expenses, and other inconvenient reductions to net income. This art form reached its most recent high (low?) with WeWork’s community-adjusted EBITDA, which cynics interpreted as accounting shorthand for “we are a high growth company, but you should exclude the expenses needed to generate that growth.” Advocates of this practice claim it provides a more realistic view of a company’s future earning power. Naysayers claim it’s a ruse to explain away a stock’s overvaluation by re-imagining the earnings denominator.
Whatever your philosophical leaning, the practice of adjusting earnings has left investors with too many watches to consult. Stocks may look expensive on one earnings number but cheap on another, and investors need to be aware of the differences in earnings metrics as they try to determine a company’s true economic earnings and valuation. A client inquiry prompted us to look deeper into the topic of adjusted earnings to gauge the slippage between commonly-referenced earnings clocks.
S&P 500 Earnings Per Share
Adjusted earnings are somewhat arbitrary numbers, and we identified four versions of S&P 500 EPS that help tell the story of unusual items and Wall Street adjustments.
-
Reported EPS (sourced from S&P): This series is the best match for GAAP and serves as our earnings baseline.
-
Operating EPS (sourced from S&P): This series removes unusual items to represent the notion of continuing earning power, and has the “blessing” of S&P.
-
Wall Street EPS (sourced from FactSet Estimates database): This series calculates earnings on the same basis that Wall Street analysts use to develop forward estimates, and they appear to be even more generous at excluding expenses.
-
Forward 12-Month Estimates (sourced from FactSet Estimates database): This series is Wall Street’s estimate for EPS as it stood twelve months before the reporting period ended. We include this to capture the level of optimism that is typically present in forward estimates.
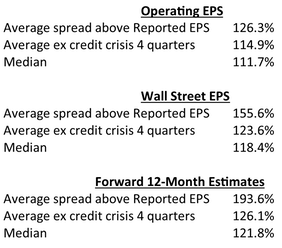
Table 1

Table 1 presents the relationships between these EPS series measured over rolling four-quarter windows through March 2018. Reported EPS is our baseline value set at 100% and each alternative series is scaled relative to that base. The four quarters from December 2008 through September 2009 saw massive write-offs coming from the credit and housing crisis, and these losses created huge spreads between reported and adjusted earnings which badly skew the averages. As such, we present medians, full historical averages, and averages excluding the four quarters specifically affected by the credit crisis.
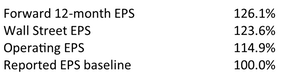
Table 2 stacks the four series to visualize the relative spreads based on their differing perspectives and definitions, using averages excluding the credit crisis quarters.
Table 2
These results suggest that operating earnings tend to run about 15% above reported earnings, a figure that matches our general impression going into the study. Wall Street earnings, which exclude even more expenses, run 23% higher than reported earnings and almost 10% higher than the already-adjusted operating figures from S&P. The forward 12-month estimate spread is a combination of expense exclusions and Wall Street’s habitual over-enthusiasm for next year’s prospects. Forward earnings run 26% higher than eventual reported earnings, and 11% higher than operating results.
We are particularly intrigued by the finding that 12-month forward estimates show only a 2.5% spread over Wall Street results. Market watchers often reference the fact that forward estimates are often well above operating earnings and thus assume analysts are way too optimistic; in fact, they are only slightly above the Wall Street definition of EPS. While it is commonly assumed that the gap between forecasts and operating earnings is caused by chronic exuberance, in reality the gap looks to be driven by differing definitions of earnings far more than excessive optimism. Compared to Wall Street’s version of EPS, forward estimates come in remarkably close.
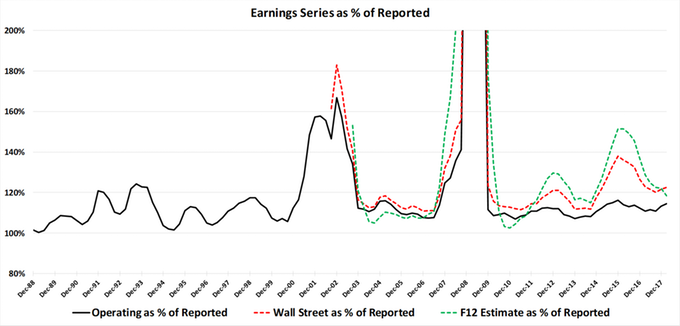
Chart 1 presents the same data in a time series, with the 2009 distortions blowing off the scale due to reported earnings (the denominator) that almost touch zero. An interesting feature of this chart is that none of the adjusted EPS lines ever fall below 100%. Unusual items and adjustments always act to lift earnings, never reducing reported results. We also note the average spreads look to have widened since 2010 as the tolerance for ever-larger exclusions seems to be growing.
Chart 1
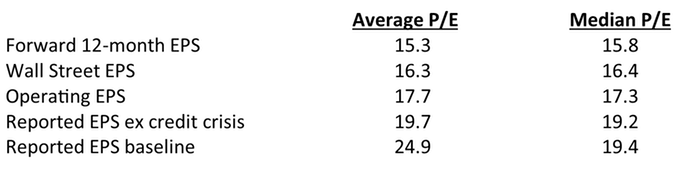
P/E Ratios
Since we have four different earnings watches to consult, that means we also have four different average P/E ratios to use as a valuation standard. We evaluated P/E ratios for each earnings measure beginning in September 2003, the first quarter that covers all four series. Table 3 reveals that the market’s average P/E ratio can be defined anywhere between 15.3x and 24.9x, opening the door to all sorts of misleading price forecasts. For example, applying a 19.7x multiple to the 2018 earnings forecast of $161 produces an S&P 500 price target of 3,178. Of course, this is mixing apples and oranges; investors need to be careful to match their assumed average valuations with the appropriate EPS series.
Table 3
Unusual Items And Composite Results
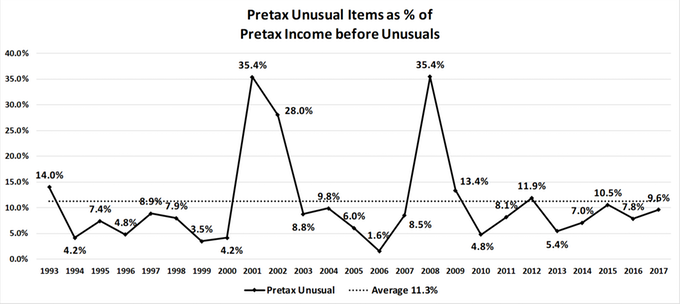
We now turn from S&P 500 EPS to consider the impact of unusual items on corporate financial statements. In this section we aggregate the 1,000 largest U.S. companies and tabulate unusual items compared to other income and balance sheet items. Chart 2 begins by comparing total pretax unusual items to pretax income before unusual items. Most observations are below 10%, and during good economic times even fall below 5%. However, large spikes in times of economic distress raise the average to 11.3%, a value somewhat consistent with our 14.9% spread between operating and reported EPS in the previous section.
Chart 2
M&A And Capital Allocation
Turning our attention specifically to corporate investments and capital allocation decisions, we narrowed our definition of unusual items to focus on those that may have resulted from merger and acquisition activities that subsequently turn out to have been unwise or imprudent. Again, with no official definitions in place we created our own basket of items that we believe could reasonably be traced back to poor M&A and capital investment decisions. We isolated six categories of unusual items in the FactSet database that are available after tax:
- Acquisition/Merger write-offs
- Purchased R&D write-offs
- Other write-downs
- Restructuring charges
- Goodwill impairment
- Other unusual items
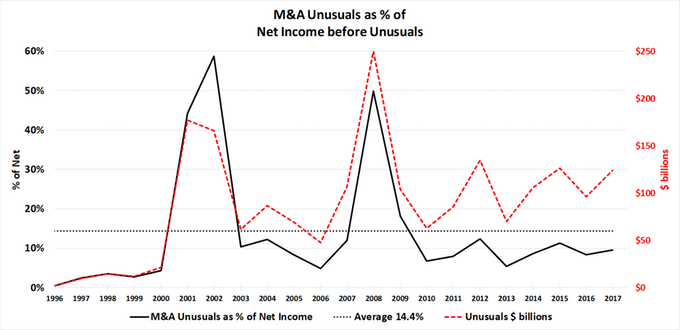
Chart 3 presents the sum of these unusual items as a percentage of net income before unusuals. Scanning the data, it appears that aggressive use/reporting of these accounting items did not begin in earnest until 1997, but after that the trends are unmistakably upward. The norm for this ratio appears to be close to 10% per year, with spikes bumping the average to 14.4%. The total dollar value of after-tax charges in 2017 stood at $124 billion and has topped $120 billion in three of the last six years—all without a major recession or bear market!
Chart 3
It is important to note that accounting standards act like a one-way mirror in this situation. Companies must write-off poor decisions but are not allowed to write-up good decisions, meaning that these M&A charges only reveal the negative side of the story. The net result of corporate M&A may be accretive to economic value, but the accounting rules do not enable us to make that judgment.
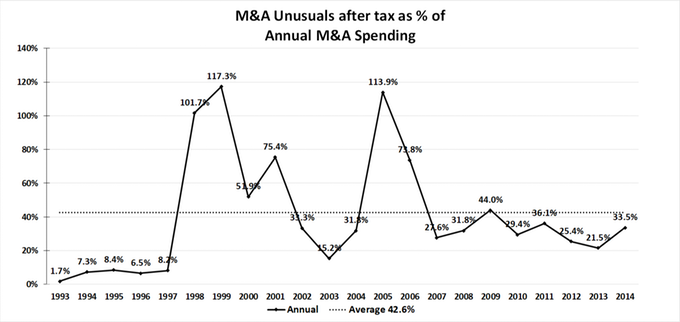
We next wondered how the level of M&A write-offs compared to acquisition activity, and calculated the after-tax level of our M&A unusual items compared to annual spending on M&A drawn from company cash flow statements. We were amazed to find the amount of corporate investment that ends up in the scrap heap (imperfectly defined, as it is) averages more than 40%, shown in Chart 4. Even excluding the peak recessionary years, the value is often above 30%. We are not sure whether this is indicative of poorer decision making in the M&A department, more aggressive use of unusual write-offs in recent times to cover up the mistakes, or both.
Chart 4
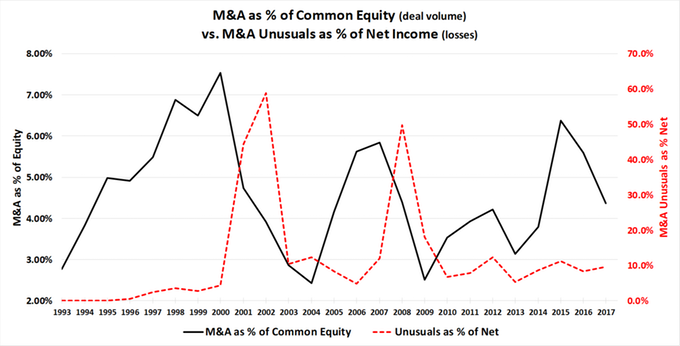
Our research further suggests that it doesn’t take management long to “kitchen sink” the write-offs related to corporate investments. Chart 5 compares corporate investment write-offs as a percent of net income (from Table 3) versus M&A expenditures as a percent of common equity, a measure of deal volume. M&A volume peaks in 2000 and 2007 were quickly followed by spikes in M&A charges to more than 50% of net income just one or two years after the spending binge. Interestingly, the third M&A volume top in 2015 has not seen an accompanying surge in write-offs. Better decision-making? Or have the chickens not yet come home to roost?
Chart 5
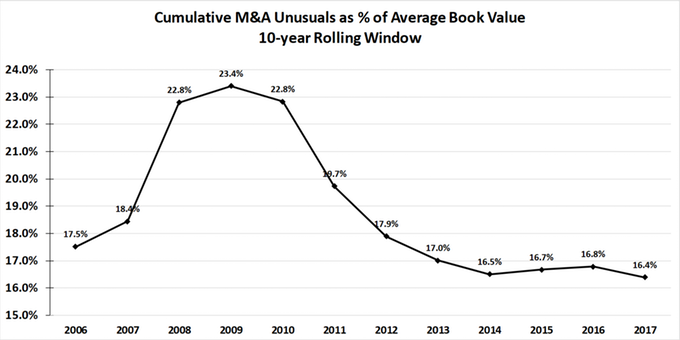
Finally, we developed a sense of how the growth in unusual charges has affected book value by summing write-offs over a ten-year window and dividing by the average book value over that same period. Chart 6 presents this smoothed data and suggests that between 15% and 20% of book value is destroyed by poor M&A and related corporate errors. We suspect that the combination of write-offs against book value and the reduction in equity that results from large stock buybacks has significantly reduced book value compared to what it might have been under the culture and protocols in place 20+ years ago. This has wide-ranging implications for all sorts of financial ratios including ROE and popular valuation metrics based on book value.
Chart 6
Do Investors Walk The Walk?
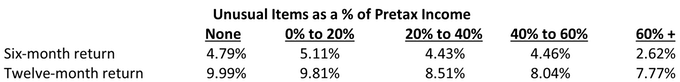
Many analysts and portfolio managers say that unusual items should be excluded in order to properly define a company’s earning power, but talk is cheap. What really counts is whether investors actually ignore write-offs in setting stock prices. We tested the fit between the talk and the walk by grouping the 1,000 largest U.S. companies into quintiles based on their quarterly ratio of unusual items to pretax income before unusuals, then calculated the cap-weighted average six-month forward returns for each group. If large unusual write-offs affect stock returns, then we would expect group performance to decline as the write-off percentage goes up.
The six- and twelve-month returns in Table 4 seem to confirm that investors, for the most part, put little weight on unusual items in setting near-term stock prices. The returns across quintiles vary slightly in the first six months but, in general, do not indicate a consistent trend toward lower returns for higher write-off companies. The highest quintile, which captures companies writing off more than 60% of net income in a quarter, does show a meaningful dip but is, remarkably, still positive. Twelve-month results seem to penalize write-offs in the higher groupings, but again show no great tendency to take the highest charge-off companies to the proverbial woodshed.
Table 4
Adjusted earnings may be an economically sound way to evaluate company performance, or it may be financial puffery supported by smoke and mirrors. Whatever one may think about the integrity of each earnings series, it appears that investors have collectively adopted the valuation convention that unusual items are a minimal consideration and that adjusted earnings present a fair picture of value creation. Table 4 reveals that investors appear willing to largely ignore unusual items. Only charges greater than 60% seem to lead to a noticeable decline in stock performance, and even then, the results are not catastrophic.
Research Takeaways
- Compared to GAAP numbers, operating earnings exceed reported earnings by 15%, and Wall Street earnings are more than 26% above reported earnings. Spreads appear to be getting larger since 2010.
- A basket of unusual items that relate to M&A activity and related corporate investments accounts for over 14% of net income, and it is common for these write-offs to represent more than 30% of a year’s M&A spending.
- Unusual items reduce book value by 15% to 20% on a rolling 10-year basis which will impact important financial ratios derived from book value calculations.
- Write-offs appear to have a limited impact on near-term returns, suggesting that investors do in fact ignore unusual items when pricing stocks, whether or not these items represent true economic losses in the long run. Investors’ actions match their words; valuations and stock prices look to be based on adjusted earnings. Whether that convention holds in the next severe bear market, only time will tell.
© 2018 The Leuthold Group
www.leutholdfunds.com
Read more commentaries by The Leuthold Group