“October: This is one of the peculiarly dangerous months to speculate in stocks. The others are July, January, September, April, November, May, March, June, December, August, and February.” — Mark Twain, Pudd’nhead Wilson
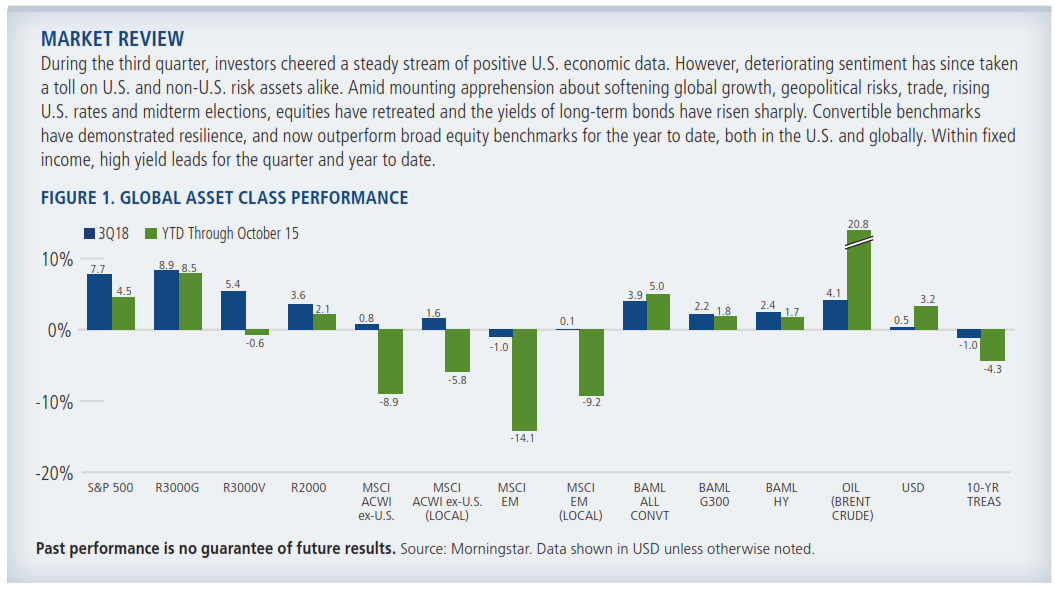
Whether or not one believes in the “October Effect,” investors can’t be blamed for giving it credence this year. Worries about trade, the Federal Reserve and global growth roiled the markets as the fourth quarter began. Even U.S. equities—which had roared through the third quarter as investors focused on positive economic data—succumbed to the selloff that gripped risk assets (Figure 1).

Market turbulence is likely to intensify as U.S. midterm elections approach and trade concerns persist. However, as Mark Twain observed, speculation is always dangerous. We believe it’s especially ill-advised when markets are volatile. The prospect of more turbulence may be discouraging for investors, but we see many opportunities for our active approaches, which are guided by fundamental research, our identification of long-term themes, and rigorous risk management. We believe investors will benefit by maintaining a diversified approach that includes equities, convertibles, fixed income and alternative strategies.
United States
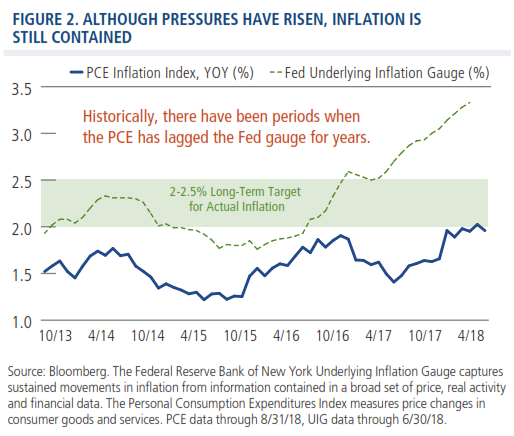
The U.S. economy looks set to continue on its growth trajectory for the next year, if not longer. Our positive outlook for the U.S. economy reflects many factors. Deregulation and tax reform have already provided a powerful wind in the sails for U.S. economic activity and corporate earnings, but we believe the full measure of these business-friendly policies has yet to be fully reflected in the economy. The banking sector is in good health and financial conditions have not become restrictive in the wake of Fed rate increases. Corporate earnings are robust, and business sentiment is upbeat. Employment data and consumer confidence are strong, and wage growth is subdued. Although the Fed’s Underlying Inflation Gauge indicates signs of pressure (which is not surprising at this stage of the economic cycle), the Personal Consumption Expenditures Index indicates that actual inflation is still contained. At current levels, PCE inflation is still below the Fed’s long-term target (Figure 2). While we are monitoring slowing auto sales and homebuilding data as well as recent increases in consumer loan delinquencies, we do not believe these measures warrant anxiety at present.
Although our outlook for the U.S. economy is positive, we expect continued volatility in the markets due to political and geopolitical uncertainties. As we have discussed in past commentaries, the run up to midterm elections will stoke turbulence, and trade will continue to figure prominently as a source of investor anxiety. The escalation in tensions between the U.S. and China may take time to unwind, and we will be closely following corporate earnings announcements to better gauge the future impact on specific industries and businesses. However, the recent agreement reached by the U.S., Canada and Mexico supports our expectation that the U.S. will achieve a better balance of trade with its major partners over the long term, despite the noisy headlines difficult negotiations generate.
With the Fed having raised short-term rates eight times this cycle, some question if more hikes will take a toll on economic growth and risk assets. While we can never rule out a policy mistake—by either the Fed or other central banks—we do not view the Fed’s current course as an imminent threat to economic growth and the markets. There are some important differences between this tightening cycle and past cycles: The Fed has been lifting rates from historically low levels, U.S. fiscal policy provides strong support for economic growth, and global central banks continue to provide liquidity.
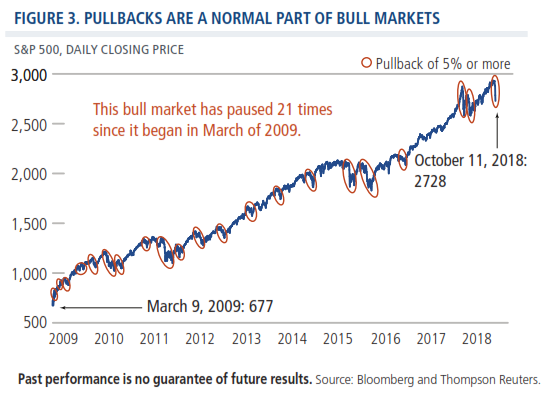
We believe the U.S. equity bull market still has legs. As we have noted in past commentaries and our recent post (“When Volatility Surges, Stay Long Term”), pullbacks are a healthy part of bull markets. Since this current advance began in March of 2009, the S&P 500 has had 21 selloffs of 5% or more (Figure 3). With a forward P/ E of 16.1x, equity valuations are not extreme based on earnings expectations. Even so, this phase of the economic cycle demands greater patience and caution. Market leadership will likely be rotational, with late-year bounces within lagging and depressed sectors. Within the equity market, we are favoring growth-oriented companies in traditional and cyclical industries that offer pricing power, quality earnings and resilient balance sheets. We are wary of being overly exposed to the crowded trade in highly valued technology names.
Global and International Strategies
So far, 2018 has been particularly unkind to non-U.S. markets, as investors have tunneled in on the potential impacts of trade policy, rising U.S. interest rates, more mixed economic data, and political uncertainties. While we are vigilant to these forces, we continue to find many reasons to be constructive on select non-U.S. investments.
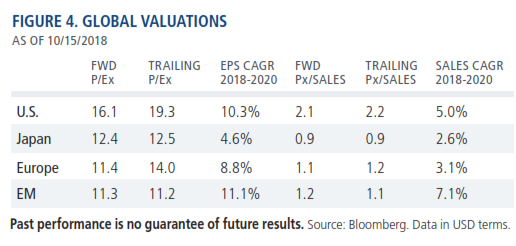
From a fundamental standpoint, we expect economic growth outside the U.S. to accelerate, with China and Europe likely to embark on more stimulative fiscal policy. We foresee a stable-to-easing bias continuing from the European Central Bank, the Bank of Japan and the People’s Bank of China. There’s likely to be tightening in some emerging markets’ monetary policies to the extent necessary to defend currencies, but this trend could abate if global growth improves this year. At current valuations (Figure 4), even a modest turn in global economic data could provide a significant boost to non-U.S. equity markets.
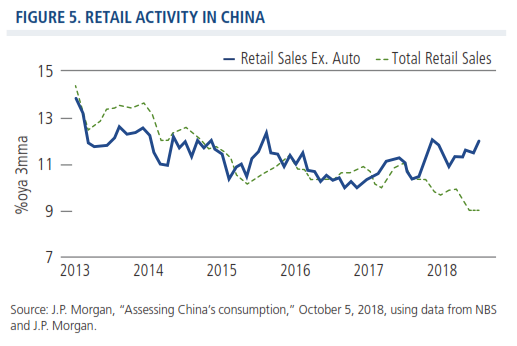
We maintain high conviction in our strategy of investing in companies with strong fundamentals and exposure to the long-term growth themes that can provide resilience in more tumultuous climates. We see additional opportunities in China for our selective approach. In addition to the fiscal stimulus we anticipate later this year, the consumer has been resilient. Auto sales have fallen, but declines are not indicative of the overall health of the retail sector (Figure 5) and also reflect a waning of government incentives (see our post “Finding Growth ‘Under the Hood’ in China”).
Accordingly, Chinese companies that provide exposure to mobility and connectivity themes and the global consumer (for example, technology-based retail names) are well represented in our portfolios. We’ve sought to use volatility to our advantage, adding to our favorite positions as prices have fallen. We have also positioned our global and international strategies to benefit from a rise in energy prices that would result from rising geopolitical risk or improved global growth.
Convertible Securities
Global convertible issuance totals $74 billion through the third quarter. U.S. companies account for the majority of issuance ($46 billion), followed by Asia ex-Japan ($13.6 billion). Although issuance slowed in the third quarter, year-to-date levels already approach 2017 full-year issuance. Short-term volatility spikes may temper issuance during these next months, but we expect healthy supply as companies move forward with growth initiatives in an expanding economy.
In an environment characterized by economic growth, rising interest rates and choppy equity markets, convertible securities offer many opportunities for investors, either as a fixed income alternative or as a way to participate in equity markets with less potential downside. Convertibles have tended to outperform traditional bonds when interest rates rise. (See our post “Convertible Securities: Reasons for Optimism.”) During this selloff, convertibles have not been immune but have demonstrated greater resilience overall than the equity market.
However, as recent conditions have once again demonstrated, active management is essential given the range of characteristics in the convertible universe. In our positioning, our focus remains on achieving an asymmetrical risk profile with more equity upside participation than downside participation over full market cycles. Throughout the year, we have been very mindful of potential downside risk, resulting in a cautious approach toward the most equity sensitive issues. This positioning has served us well as market volatility has ramped up. We have sought to use the downturn to our advantage, adding positions as valuations become more attractive. From a sector standpoint, we favor technology companies (including internet security, cloud computing, software and big data) and industrials.
Fixed Income
The Federal Reserve has communicated its intention to maintain a deliberate course of tightening, moving more aggressively if inflation becomes a concern and less aggressively if economic momentum slows. Given the health of the economy, we do not believe the market’s pullback will dissuade the Fed from raising rates one more time in 2018. Short-term rates are likely to settle in a range of around 2.50% to 2.75% by next summer.
We believe our focus on downside risk management will be especially important in this late-cycle environment. Our bond-by-bond, bottom-up portfolio approach focuses on being well compensated for the risks we undertake. Reflecting our risk-conscious approach, we are maintaining conservative durations, shorter than comparable benchmarks. Our positioning reflects a preference for corporate credits and asset-backed securities versus U.S. Treasury bonds and mortgage-backed securities.
We continue to identify opportunities in high yield securities, a sector that can benefit from its economic sensitivity and potentially reduced vulnerability to interest rates versus investment grade issues. We have invested in energy issues positioned to benefit from an upswing in the crude-oil super cycle, as well as in select consumer cyclical issues, including homebuilders with relatively high quality balance sheets.
We also see compelling potential in short-duration high yield issues, an area which is often less widely followed. (See our post “Short-Term High Yield: The Road Less Traveled.”) We remain vigilant to prices, as supply in the market has steadily decreased, due in part to issuers turning to the leveraged loan market to access capital.
In our previous outlook, we shared our concerns about the investment grade market, where issuers have taken on more leverage in a low rate environment. With BBB rated credits making up nearly half of the investment grade market (their largest percentage in three decades), we believe the next downturn could bring the largest fallen angel volume in history.
Conclusion
Although uncertainties and volatility will shape the markets over these next months, we believe our active, risk-managed approach is suited to this environment. We encourage investors to maintain a long-term perspective, and not fall into the trap of trying to time the markets. Drawing on more than 40 years of experience, we look forward to capitalizing on the trends and opportunities we see in the markets.
Indexes are unmanaged, not available for direct investment and do not include fees and expenses. The U.S. Dollar Index measures the value of the U.S. dollar relative to a basket of foreign currencies, including Euro Area, Canada, Japan, United Kingdom, Switzerland, Australia, and Sweden. The Russell 3000 Growth Index and Russell 3000 Value Index measure U.S. growth and value equities, respectively. The Russell 2000 Index measures U.S. small cap stock performance. The S&P 500 Index is considered generally representative of the U.S. equity market. The MSCI All Country ex U.S. Index represents the per formance of global equities, excluding the U.S. The MSCI Emerging Markets Index is a measure of the performance of emerging market equities. The ICE BofAML U.S. High Yield Index is an unmanaged index of U.S. high yield debt securities. The ICE BofAML All U.S. Convertible Index (VXA0) is a measure of the U.S. convertible market. The ICE BofAML G300 Index measures the performance of 300 global convertibles. Oil is represented by current pipeline expor t qualit y Brent blend. Core PCE is a gauge for inflation, measuring personal consumption expenditures excluding food and energy prices. The Underlying Inflation Gauge seeks to capture sustained movements in a broad set of prices, incorporating additional macroeconomic and financial variables. ICE Data: Source ICE Data Indices, LLC, used with permission. ICE permits use of the ICE BofAML indices and related data on an `as is’ basis, makes no warranties regarding same, does not guarantee the suitability, qualit y, accuracy, timeliness, and/or completeness of the ICE BofAML Indices or data included in, related to, or derived therefrom, assumes no liability in connection with the use of the foregoing and does not sponsor, endorse or recommend Calamos Advisors LLC or any of its products or ser vices. Earnings per share (EPS) is a company’s profit divided by its number of outstanding shares. Price-to-earnings ratio (P/E) is a valuation ratio of a company’s current share price compared to its per-share earnings; forward P/Es are based on forecasted earnings. CAGR, or compounded annual growth rate measures year-over-year growth. Price-tosales ratio measures a company’s stock price versus its revenues. Fallen angels are investment grade bonds that are downgraded to below investment grade ratings. Opinions, estimates, forecasts, and statements of financial market trends that are based on current market conditions constitute our judgment and are subject to change without notice. The views and strategies described may not be suitable for all investors. References to specific securities, asset classes and financial markets are for illustrative purposes only and are not intended to be, and should not be interpreted as, recommendations
Calamos Investments LLC 2020 Calamos Cour t | Naper ville, I L 60563-2787 800.582.6959 | www.calamos.com | [email protected] Calamos Investments LLP 62 Threadneedle Street | London EC2R 8HP Tel: +44 (0)20 3744 7010 | w ww.calamos.com/global ©2018 Calamos Investments LLC. All Rights Reserved. Calamos®and Calamos Investmentsare registered trademarks of Calamos Investments LLC.OUTLKCOM 18678 1018O C
This material is distributed for informational purposes only. The information contained herein is based on internal research derived from various sources and does not purport to be statements
of all material facts relating to the information mentioned and, while not guaranteed as to the accuracy or completeness, has been obtained from sources we believe to be reliable.
NOT FDIC INSURED | MAY LOSE VALUE | NO BANK GUARANTEE
© Calamos Investments
© Calamos Investments
Read more commentaries by Calamos Investments