There are different investment approaches to identify sector winners and losers, such as price momentum strategies, top down approach based on specific macroeconomic indicators or bottom-up approaches to identify sectors with improving fundamentals. One widely used approach is business cycle analysis. Since economic cycles usually exhibit characteristics that impact sectors or industries differently, investors may identify sectors that are favored by the current economic phase.
A standalone business cycle based sector rotation is difficult to implement, as differences exist on economic conditions of each cycle over time and transformative technology continues to alter business models and economic impact. However, understanding cycle dependency on sectors is important to sector portfolio construction, particularly for a top-down approach.
To make a quantitative and systematic assessment of how different sectors performed through various business cycles, we used the Conference Board Leading Economic Indicator Index (LEI) to segregate business cycles and evaluated sector performance over multiple business cycles between 1960 and 2018. This provided a good sample size to evaluate sector performance persistency for different cycles.
Understanding and Defining Business Cycle
The concept of a business cycle was first introduced by Wesley C. Mitchell and Arthur F. Burns. They took the indicator approach that uses cyclical economic indicators to explore patterns of economic fluctuations.
“Business cycles are a type of fluctuation found in the aggregate economic activity of nations that organize their work mainly in business enterprises: a cycle consists of expansions occurring at about the same time in many economic activities, followed by similarly general recessions, contractions and revivals which merge into the expansion phase of the next cycle.” — Wesley C. Mitchell and Arthur F. Burns1
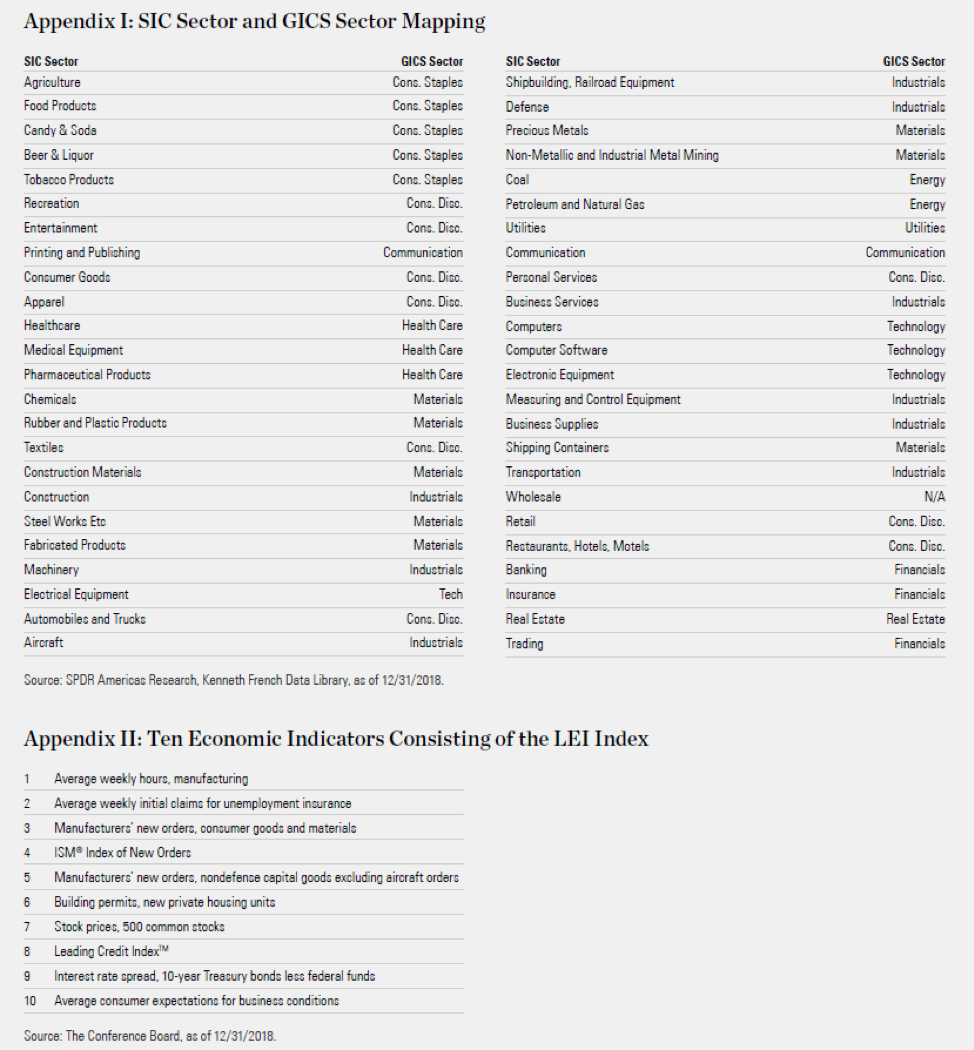
First published by the U.S. Department of Commerce as part of the Business Cycle Indicators program in late 1960s, the Conference Board’s LEI Index follows this approach by aggregating ten economic indicators (See Appendix II), ranging from employment, business orders and financial conditions to consumer expectations, to summarize common turning point patterns in economic data. The indicators included in the composite index have survived a wide variety of statistical and economic tests, such as consistency, economic significance, statistical adequacy, smoothness and promptness.
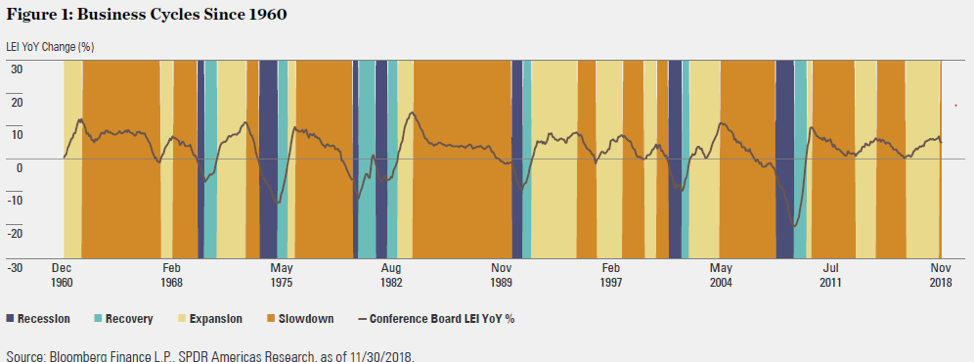
Most of the research on business cycles defines only recession and expansion through identifying peak and trough. However, we believe there are more nuances in different stages between a peak and trough. Therefore, we divided the business cycle based on the direction and magnitude of changes of the Conference Board LEI Index.
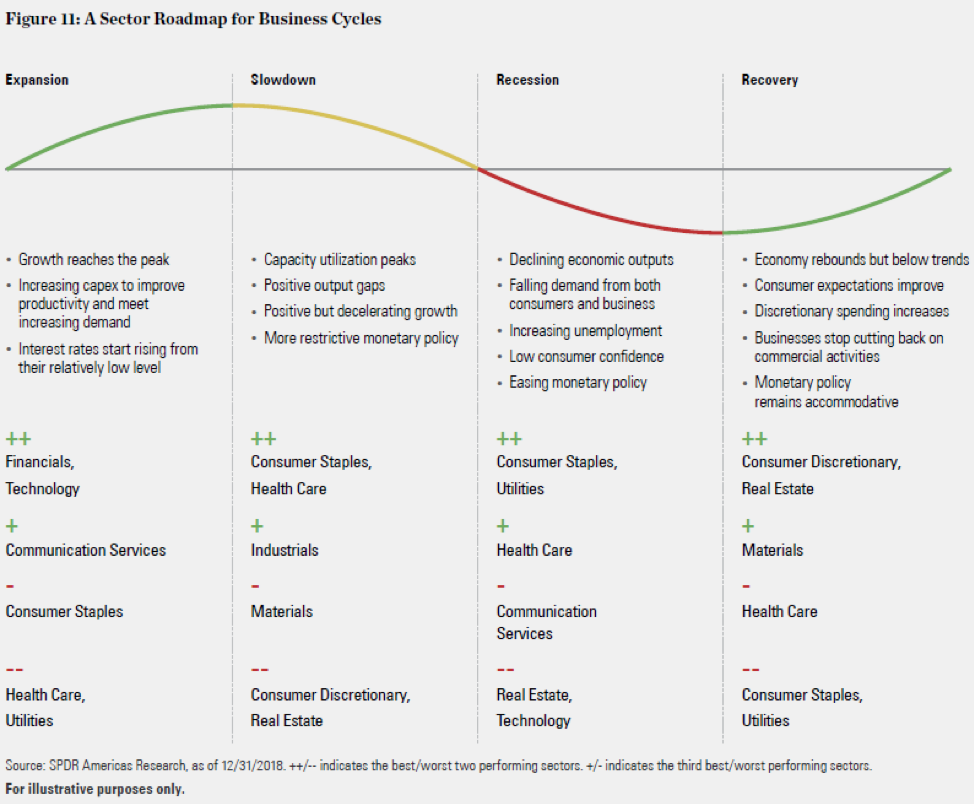
The chart below shows the delineation between these parts of the cycle.
- Recession: The LEI Index declines to a trough at an accelerating pace2
- Recovery: The LEI Index rebounds from a trough but below long-term trends
- Expansion: The LEI Index YoY changes are positive and above long-term trends
Evaluating Sector Performance Over Multiple Business Cycles
Although Global Industry Classification Standard (GICS®) sector classification has become widely recognized and tracked by market participants, its performance history is limited, going back to 1989 and covering only three recessions. To get a comprehensive account of sector performance over multiple business cycles, we leverage the performance data of Kenneth French 48 SIC-based (Standard Industrial Classification) industry portfolios back to 1961 and map them to GICS sectors based on the latest GICS sector definitions. We then equally weigh industry performance to create a longer sector performance history that covers seven recession and recovery periods, 12 expansions and 11 slowdowns. Appendix I lists the GICS sectors assigned for the 48 SIC-based industry portfolios.
In order to fully evaluate sector performance over business cycles, we assess how well the sector performed and how consistent the performance is in each type of cycle by using the following six metrics:
- Average monthly sector return
- Average monthly sector excess return over the broad market3
- Average return of the sector over each business cycle4
- Average excess return of the sector over each business cycle
- Percentage of months when the sector outperformed the broader market
- Percentage of cycles when the sector outperformed the broader market
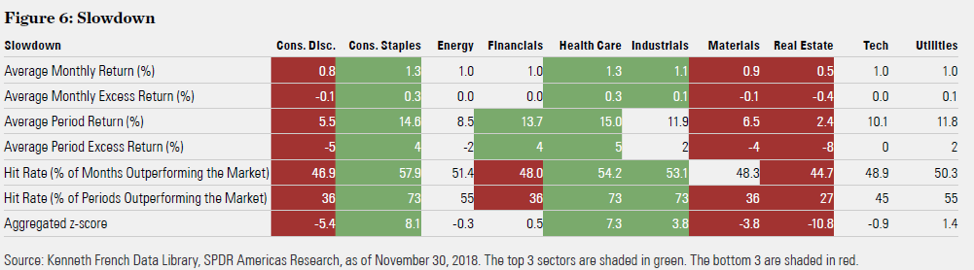
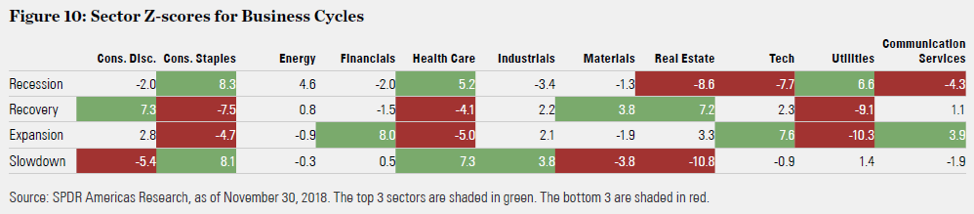
We then calculate the sector z-scores based on these metrics to standardize results across all sectors and allow for easy comparison. Next, we calculate a composite score by equally weighting each metric to identify top and bottom three sectors for each business cycle. Following are our findings on sector performance during different phases.
Four Stages of the Business Cycle
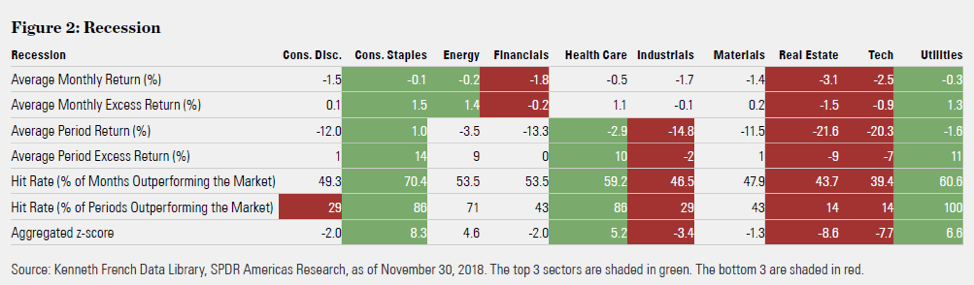
Recession: During a recession, economic activities fall significantly across the board, with declining economic outputs and aggregate demand from both consumers and business. It features increasing unemployment, low consumer confidence and contractionary domestic production. Monetary policy attempts to increase aggregate demand by lowering interest rates and increasing the money supply.
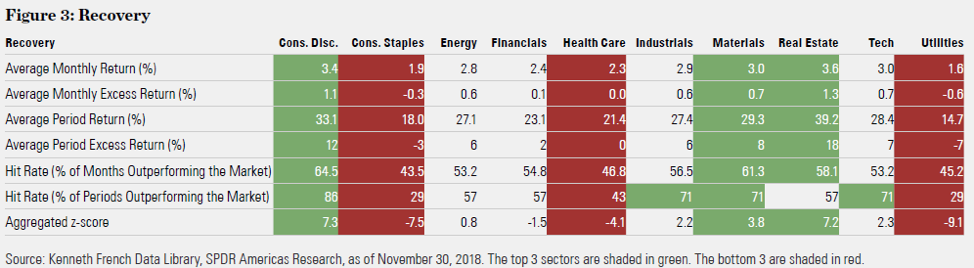
Recovery: During a recovery, the economy rebounds sharply from the bottom, but below trend. GDP growth and aggregate demand accelerate. Consumers become more positive about economic growth and start taking advantage of the low interest rates and increasing their discretionary spending, while businesses stop cutting back on commercial activities.
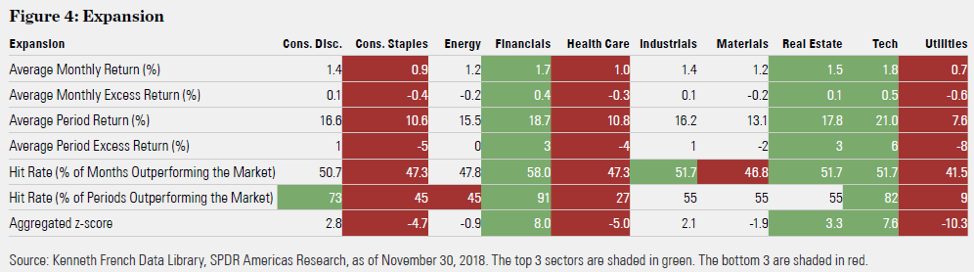
Expansion: Economic growth reaches the cycle peak. Amid rosy economic prospects and increasing corporate profits, companies begin to allocate capital to expand business and improve productivity to meet increasing demand. Interest rates start rising from their relatively low level.
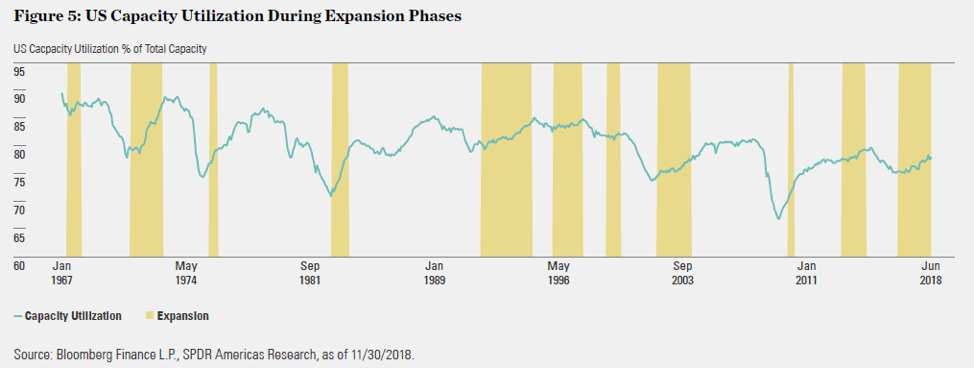
Slowdown: Capacity utilization usually reaches cycle peaks and economic output gaps turn positive, meaning the economy is running beyond full capacity. Limited capacity constrains economic growth from accelerating further, leading to positive but decelerating growth. Monetary policy becomes more restrictive to steer the economy away from overheating.

As shown in the table above, during a recession, non-cyclical sectors, like Consumer Staples, Utilities and Health Care, performed well, as their business ties to nondiscretionary spending which is less sensitive to economic fluctuations. They outperformed the broader market on an average of more than 10% during six of seven recession periods. Real Estate and Technology are among the worst performing sectors across all the metrics. As their business ties to highly discretionary spending for both consumers and business, these sectors tend to be the first to experience spending cuts in a period of diminishing income and business activities.
In a recovery phase, improvement in the labor market and consumer confidence leads to increases in discretionary spending on restaurants, travel and durable goods,5 benefiting Consumer Discretionary sectors. While recessions tend to hit the real estate market hard, the low interest rates and easing monetary policy following the recession make it cheaper and easier to purchase real estate. The recovery in commercial activities also lifts the value of commercial real estate, contributing to the Real Estate sector’s outperformance. The outperformance of Consumer Discretionary is more consistent than Real Estate, given its higher hit rate on a monthly and periodic basis. On the other hand, sectors that are favored during the recession — Consumer Staples, Utilities and Health Care — lose their attraction as the market rebounds and investors embrace more cyclical sectors to capture upturns in the market.
Expansion features narrow sector dispersion, as economic growth accelerates to its peak and more sectors benefit from the economic boom. Market returns are the second best among the four phases, following behind the recovery phase, but its duration tends to be longer. During this phase, capacity utilization tends to increases significantly to its peak, as shown in Figure 5.
Businesses feel more confident about the growth prospects and start expanding business and allocating more capital to improve productivity, such as investing in Technology. Interest rates also start moving up from a very low level. Increasing loan volume and higher interest rates from a relatively low level tend to benefit Financials. Technology and Financials’ outperformance is quite consistent, as they beat the market in ten out of twelve expansion phases. Noncyclical sectors continue to be out of favor during the economic expansion.
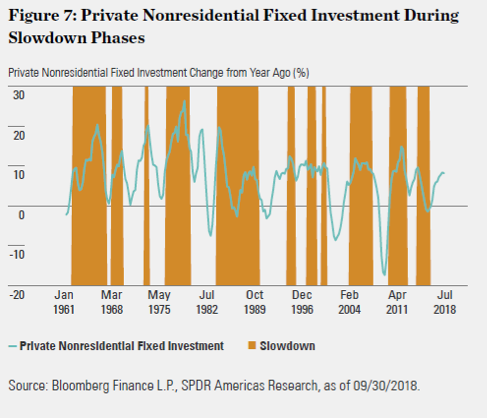
As economic growth decelerates and input costs increase, corporate profitability growth comes under pressure, remaining positive but slowing down. Given capacity and efficiency constraints, companies spend more on capital expenditure to meet demand, but there is usually a lag between the deployment of capex and rising productivity. The overall market return is the second worst among all phases. Investors start positioning more defensively and reducing their allocation to economic sensitive sectors in anticipation of the next economic downturn. This leads to the outperformance of Health Care and Consumer Staples and underperformance of Consumer Discretionary and Real Estate. Industrials is the third best performing sector, as it benefits from increasing investment in capital products. However, increases in capex did not occur or were not significant every time when economy growth slowed. As shown in Figure 7, during the 1984–1989 and 2014–2016 slowdowns, private nonresidential fixed investment declined significantly, leading to Industrials’ underperformance in both periods.
Outliers
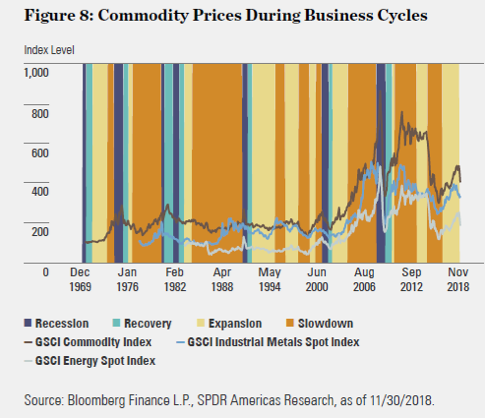
Materials and Energy are commonly expected to perform well in slowdowns as the positive output gap in this phase tends to lead prices of oil and basic materials higher and contribute to profitability. However, as these markets have become more integrated with the global market, the boom of commodity prices during US economic slowdowns has occurred less frequently since the 1980s.
Energy did not make the top/bottom three sectors during any business cycle, indicating it may not be as sensitive to US economic cycles as most people think. Energy company profitability directly ties to oil prices. Given the fungibility of the industry outputs and highly connected global commodity market, energy firms’ profits are more driven by the oil supply and demand worldwide. Since OPEC member countries produce around 40% of the world’s crude oil and its oil exports represent 60% of the total petroleum traded internationally, OPEC’s actions have significant influence on global oil prices,6 impacting US energy firms’ profits. Furthermore, geopolitical tensions can play a big role in OPEC’s actions, introducing more idiosyncratic risks to the sector. For example, the oil embargo by Arab producers against the western world in 1973, the Gulf War in the 1990s and, more recently, Venezuela’s oil crisis all impacted the market. Also, the supply glut in 2015 caused by the adoption of fracking technology shocked the energy market, weighing down energy stocks when the broad economy was slowing down.
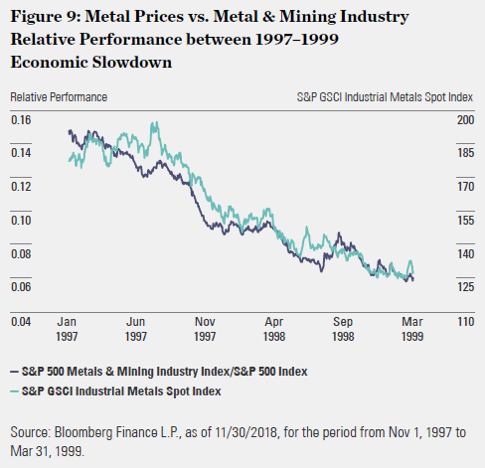
Materials: Firstly, negative idiosyncratic industry events coincided with certain slowdown periods. In the 1990s, the emergence of state-controlled chemicals and mining companies in developing countries undercut US producers and miners’ market shares and pricing power. In 1997–1998, the Asia/EM financial crisis reduced global demand for metals and mining products. Traditional metals and minerals exporters, such as Russia and Brazil, turned to the US where the economy was more insulated from the crisis to dump their extra capacity. Even though US demand of basic materials was strong in the late stage of expansion, metal prices dropped by 25% because of the flood of foreign supply, sending metal & mining stocks down by 21%, compared to a positive return of 43% for the S&P 500® Index, as shown in Figure 9.
Secondly, given that only 15% of the US GDP is contributed by goods producing industries, compared to 80% by service producing industries, the US economy has become more service-based and less reliant on resource-intensive production. The shifts of the global manufacturing center to Asia drove flows of natural resources to that region. Therefore, Materials may have become less sensitive to the overall US economic cycles, but more impacted by global economic conditions.
Establishing a Sector Roadmap for Business Cycles
Below are the 11 GICS sectors’ aggregated z-scores based on the six metrics. Given the new Communication Services consists of former Technology, Consumer Discretionary and Telecommunication stocks, we calculated its z-score as the weighted average of the three sectors’ z-score.
The above sector business cycle analysis provides general view on how sectors perform in different parts of the economic cycle. Unique characteristics and the idiosyncratic nature of each cycle warrants individual analysis on a case-by-case basis. Furthermore, secular industry trends or technological shifts that are less impacted by cyclical economic development may exist throughout multiple cycles and provide long-term growth opportunities. For example, booming biotechnological innovations, emerging robotics and automation backed by Artificial Intelligence (AI), increasing demand of cybersecurity defense.
1 Burns and Mitchell, Measuring Business Cycles, 1946, p. 21.
2 When identifying recessionary periods, we made small adjustments to the beginning month to match with the economic peak identified by the National Bureau of Economic Research. The adjustments make the beginning month of recessions more aligned with the market downturn.
3 The broad market performance is represented by the value-weight return of all CRSP firms incorporated in the US and listed on the NYSE, AMEX or NASDAQ.
4 Annualized return for the periods > 1 year, cumulative return for periods < 1 year.
5 How does consumer spending change during boom, recession, and recovery? Beyond the Numbers, June 2014, Vol. 3/No. 15, US Bureau of Labor Statistics.
6 EIA, What drives crude oil prices: Supply OPEC.
ID15351-2375281.1.1.AM.RTL 0119 Exp. Date: 01/31/2020
© State Street Global Advisors
© State Street Global Advisors
Read more commentaries by State Street Global Advisors