Is money market fund AUM growth signaling changing expectations?
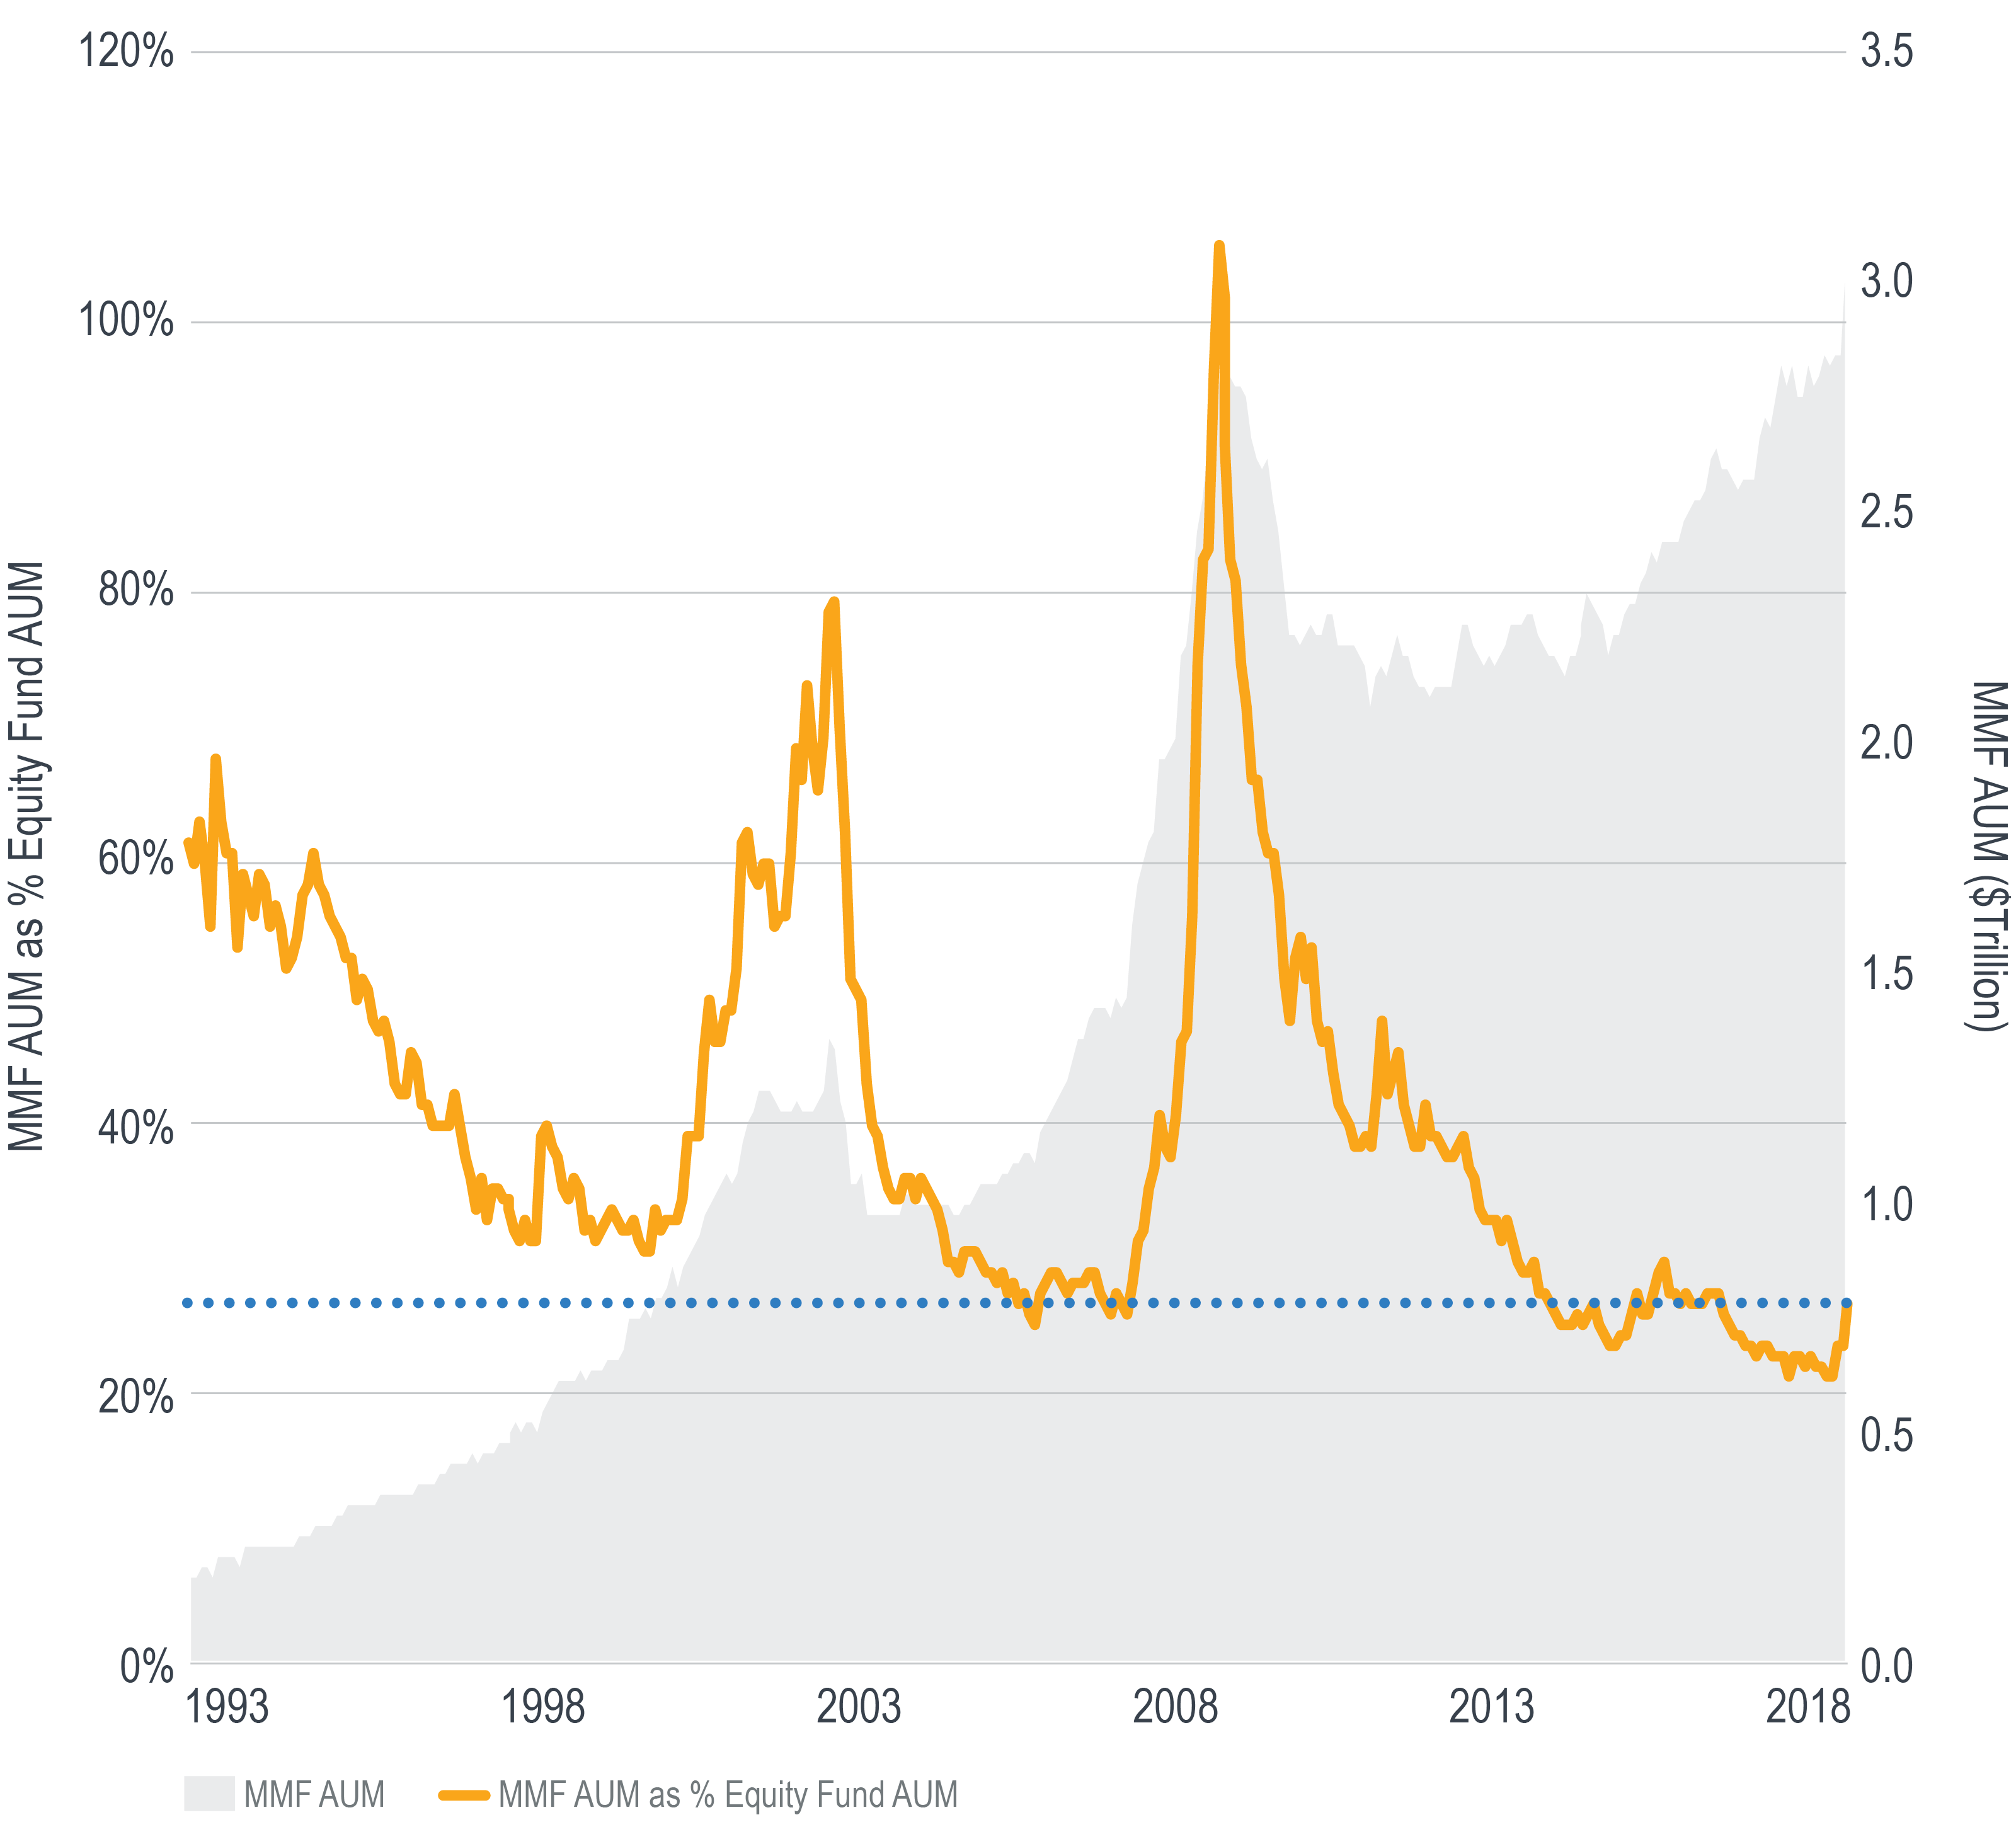
In early October 2018 we wrote here that while assets in money market funds (MMF) were sitting near their all-time high on a nominal basis, they were near an all-time low as a percentage of assets in equity mutual funds and ETFs.1
Four months later, the ratio’s downward trend has changed direction. As of the end of 2018, data from Morningstar indicate that since the end of August, assets in U.S. money market funds (MMF) have climbed $160 billion to $3 trillion, their highest level on record in Morningstar’s database.
As the numerator of this equation has been climbing, the denominator has been falling. In addition to the Q4 decline in the global equity market and its corresponding effect on fund NAVs, equity mutual funds and ETFs experienced net Q4 outflows. For now, it appears investors have put some capital on the sidelines and confidence has been reined in after a volatile fourth quarter.
Explanations offered for Q4’s performance include an overly hawkish Fed, trade wars and political uncertainty. In early 2019, it’s not unreasonable to consider all of these factors still very much in play.
Moreover, after years of yielding virtually nothing, the Fed’s December hike has lifted the weighted average MMF yield north of 2%. That’s still low by longer-term standards, but attractive relative to most of the post-2008 era and also slightly higher than the S&P 500’s dividend yield.
Whether or not such yields are enticing enough to extend MMFs’ growth trend relative to equity funds may offer valuable insight into investors’ risk tolerance levels and expectations for growth assets in the months and years ahead.
1 Source: Morningstar, as measured by mutual fund and ETF assets in Morningstar’s “US Equity,” “Sector Equity” and “International Equity” US Category Groups, as of December 31, 2018.
Unless otherwise noted, data is sourced from Bloomberg.
Recipients must make their own independent decisions regarding any strategies or securities or financial instruments mentioned herein.
The products or services described or referenced herein may not be suitable or appropriate for the recipient. Many of the products and services described or referenced herein involve significant risks, and the recipient should not make any decision or enter into any transaction unless the recipient has fully understood all such risks and has independently determined that such decisions or transactions are appropriate for the recipient.
The results shown are historical, for informational purposes only, and do not guarantee future results.
Any discussion of risks contained herein with respect to any product or service should not be considered a disclosure of all risks or a complete discussion of the risks involved.
The recipient should not construe any of the material contained herein as investment, hedging, trading, legal, regulatory, tax, accounting or other advice. The recipient should not act on any information in this document without consulting its investment, hedging, trading, legal, regulatory, tax, accounting and other advisors.
The materials in this document represent the opinion of the authors and are not representative of the views of Milliman, Inc. Milliman does not certify the information, nor does it guarantee the accuracy and completeness of such information. Use of such information is voluntary and should not be relied upon unless an independent review of its accuracy and completeness has been performed. Materials may not be reproduced without the express consent of Milliman.
Data included in this document has been sourced from providers that Milliman FRM believes to be reliable from information available publicly or with consent of the provider of the source material. To the fullest extent permitted by law, no representation or warranty, express or implied is made by Milliman FRM as to the accuracy or completeness of the source data or any other information in this document.


