Following a painful and broad fourth quarter selloff, risk assets rebounded in the first weeks of 2019 as optimism has grown about Fed accommodation, earnings, China stimulus and an eventual trade dispute resolution. However, investors should be prepared for choppy markets, especially through the first half of the year. We believe:
- Although there will be softening in U.S. economic data, the U.S. is positioned for continued slow expansion. A recession in 2019 is unlikely.
- The global economy will grow tepidly through these next months, with increased potential for acceleration in the second half of the year.
- Volatility will remain elevated, due to softening global economic data, and elevated political, geopolitical and monetary policy uncertainties. Company-specific news is also likely to roil the markets.
- The pace of earnings growth will slow from recent peaks, but equities and equity-sensitive securities—including convertible issues and high yield bonds—offer additional upside for the active manager.
MARKET REVIEW
As investors focused on slowing global growth, trade and Fed policy, risk assets succumbed to a fourth quarter selloff. A relaxation of sanctions against importers of Iranian oil and doubts about the effectiveness of OPEC production cuts led to a $30 per barrel selloff in crude oil prices, and a flight to quality fueled a Treasury rally. Sentiment through the first weeks of 2019 has improved, although volatility has persisted.
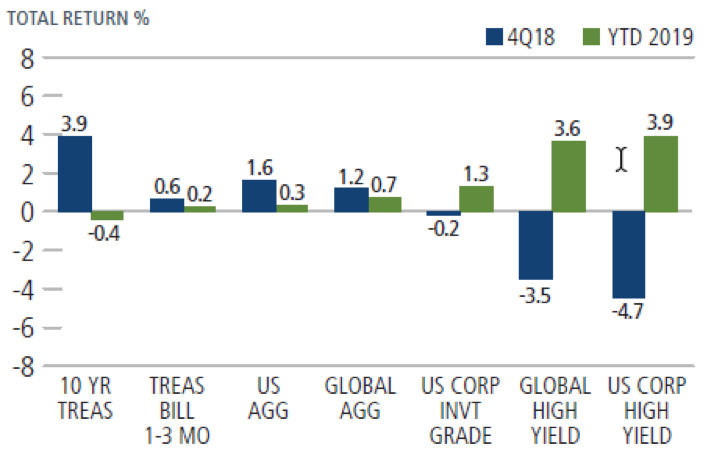
FIGURE 1. GLOBAL ASSET CLASS PERFORMANCE, TOTAL RETURN %
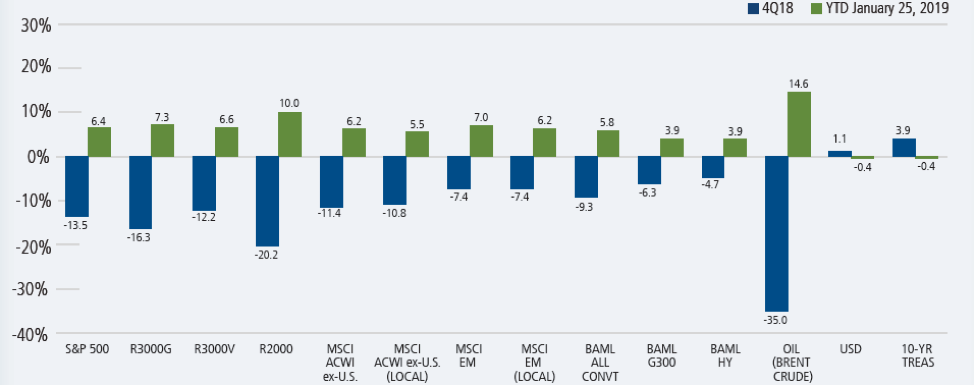
Past performance is no guarantee of future results. Source: Bloomberg and Morningstar. Data shown in USD unless otherwise noted.
U.S. Equities
U.S. economic growth and data may soften during the first half of the year due to global growth conditions and the impact of a government shutdown. Even so, we do not expect a U.S. recession in 2019, particularly given the absence of high inflation, aggressive tightening and asset price “bubbles.” Employment data is strong and wage growth gives a boost for consumers. Inflation is subdued and the Fed has affirmed its commitment to a data driven approach, which should result in fewer rate hikes than markets anticipated just a few months ago.
Recent earnings announcements have boosted Wall Street sentiment, and we believe many corporations are positioned for additional upside as they benefit from deregulation, tax reform and a healthy U.S. consumer. The rate of corporate earnings growth is likely to be more measured due to weaker global demand, and more companies may guide downward, taking cover in Apple’s recent caution. Equity valuations in many areas of the market are not extreme based on earnings expectations—especially after the fourth quarter selloff.
In regard to potential headwinds, many of the same political and geopolitical unknowns that rattled the markets in 2018 are unresolved. A high level of global uncertainty (Figure 2) could foment volatility over these next months. We also believe uncertainty about policy and policy impacts have contributed to the recent weakness in sentiment driven “soft” data. While policy calls are impossible to make with certainty, we are hopeful that trade and fiscal policy to move to a more accommodative stance as the year progresses, just as the tone of monetary policy has recently become more accommodative. We believe this could help stabilize growth at more a favorable level in the second half of 2019 and into 2020. Any reduction in uncertainty is also likely to be welcomed by the markets.
FIGURE 2. GLOBAL ECONOMIC POLICY UNCERTAINTY HAS SOARED
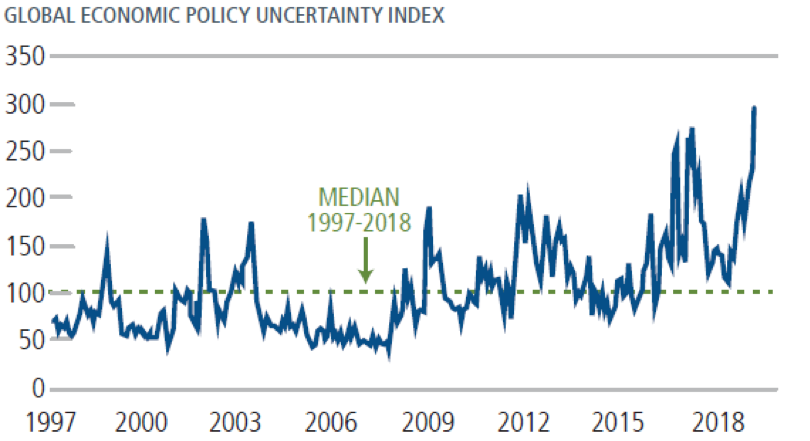
Source: Economic Policy Uncertainty.
We are closely watching for signs of growing pressures in corporate credit as corporate profit growth decelerates. One risk on the horizon is that markets confront a significant wave of forecast downgrades— for economic activity, sales, and profit margins across the U.S. and other major markets.
Our U.S. equity positioning favors companies that offer pricing power, quality earnings and resilient balance sheets. We are monitoring the impact of slowing global demand on individual companies and sectors. Across sectors, we are mindful of security valuations. Growth-oriented companies are likely to lead at this point of the cycle, and technology innovators and companies positioned to benefit from U.S. consumer strength are well represented in our strategies. We have identified more cyclically oriented opportunities for growth as well.
Global and International Strategies
Our outlook on the global economy is more cautious heading into 2019 than it was in 2018. Signs of slowdown are plentiful, and weaker demand out of China has rippled across the global economy, taking a toll on export-driven economies such as Japan. The macro landscape in Europe gives less cause for optimism as political uncertainties mount (Brexit, populism in France, Italy’s budget) and fiscal policy has provided few catalysts for stronger corporate profitability.
That said, at current valuations (Figure 3), even a modest turn in global economic data could provide a significant boost to non-U.S. equity markets—and there are certainly factors that could set the stage for such improvements. Indeed, from a fundamental standpoint, we could see economic growth outside the U.S. to accelerate in the second half of the year. If the U.S. Fed does turn more dovish and U.S. economic growth weakens at the margin, a depreciating U.S. dollar provides a tailwind to overseas markets. Also, China has just begun its easing cycle, and stimulus has not been as strong as in 2015 and 2016, from either a fiscal and monetary perspective (Figure 4a and 4b, respectively). We expect a further ramp-up in activity, which could help the Chinese economy find a more stable footing.
FIGURE 3. ATTRACTIVE GLOBAL VALUATIONS
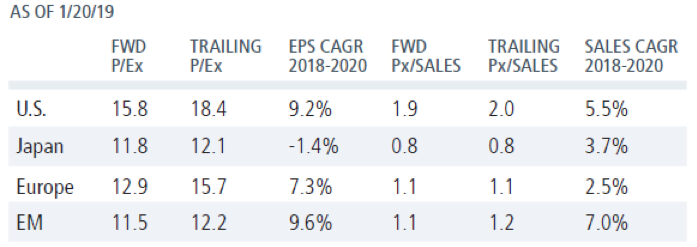
Past performance is no guarantee of future results. Source: Bloomberg. Data in USD terms.
FIGURE 4. CHINA STIMULUS: PAST VS. PRESENT
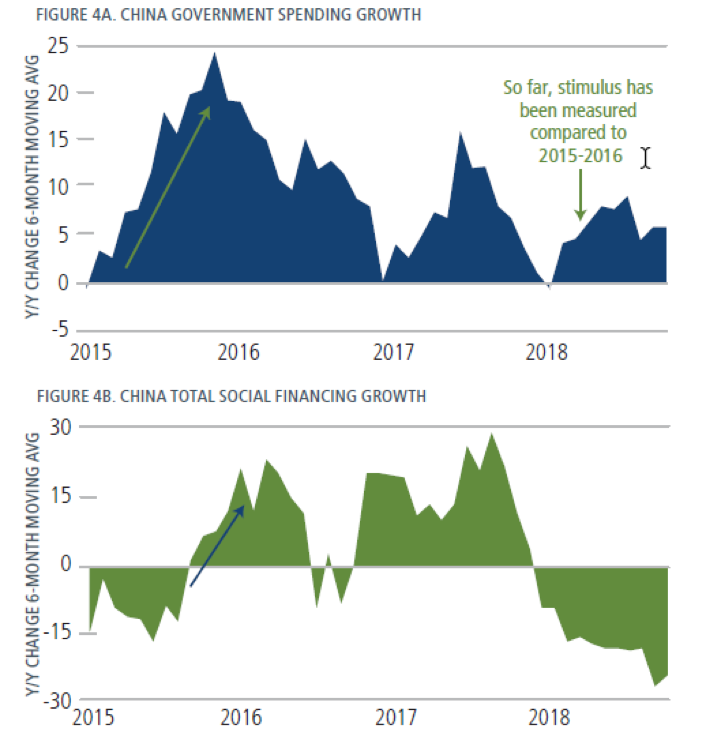
Source: Macrobond. The Total Social Financing Growth Index is a broad measure of liquidity and credit in the Chinese economy that includes off-balance sheet forms of financing that exist outside the financial sector.
Our global and international strategies are positioned to balance our cautious view of current conditions as well as our view of longer-term opportunities. We have consolidated around our higher-conviction names and find many opportunities in Emerging Asia, including China. The Chinese government’s stimulus in 2019 is much more likely to focus on removing regulations and fueling consumption, compared with previous stimulus programs that were more infrastructure centered. So, we expect the beneficiaries will differ as well, and our positioning includes companies that can profit from consumption stimulus. We also have identified a growing number of bottom-up opportunities in other Emerging Asian markets. Given our philosophy that progress toward economic reforms can provide a tailwind for growth, we have increased our exposure to Brazil, where economic recovery is in a relatively early stage. Consistent with our view that China’s stimulus will be less focused on infrastructure, we are cautious on European cyclicals, which have historically garnered substantial profits from China.
Convertible Strategies
In 2018, convertible securities provided a degree of shelter from the storm in the equity markets, with U.S. and global indexes performing better than comparable equity benchmarks. Global issuance was strong for 2018, despite a year-end slowdown as volatility soared. For the year, U.S. issuance was a brisk $51 billion, followed by Asia ex- Japan at $16 billion. We expect another strong year of issuance in 2019 as companies seek capital in a still-expanding economy.
Convertibles tend to benefit in volatile but upwardly moving markets (as the value of their embedded option rises), which makes them compelling in this environment. However, because the attributes of individual convertibles and the convertible market are constantly changing, active management is essential. During the fourth quarter, we took advantage of market volatility to rebalance and enhance the risk/reward stance of our convertible portfolios. As market conditions have evolved in 2019, we have sought to capitalize on price weakness in oversold names, including adding additional equity exposure. However, our positioning continues to reflect a risk-aware approach—which translates into caution about securities with the highest exposure to equity volatility and those with weaker credit fundamentals. From a sector standpoint, we are emphasizing technology and consumer opportunities, and structures with a good balance of upside and downside participation.
Fixed Income
The Fed was a focal point of investor anxiety in 2018, but so far has been less of a distraction to market participants in 2019, thanks to comments that suggested that it would slow in its tightening. If equities sustain a grinding recovery off December lows, the Fed may feel it has an all-clear from the market to resume its tightening campaign and balance sheet reduction. Barring that, the Fed is likely to pause. Improving wage growth and employment gains might suggest that inflation pressures are building, but realized inflation is well contained. In fact, some data tracking the underlying drivers, such as the Federal Reserve Bank of New York Underlying Inflation Gauge, indicates that pressures peaked in mid-2018 and have since rolled over. As long as inflation remains subdued and given the probability of slower growth around the world, we believe the fed funds rate will settle in around 2.50%-2.75% by year end, with the 10-year yield in the range of 3.00%, or even a bit lower. Investor anxiety about yield curve inversion will persist. However, as we have discussed in past commentary, although inversions have been a reliable predictor of recessions, there is often a lag of several quarters between inversion and economic contraction.
During the fourth quarter, de-risking sent investors fleeing to the haven of the 10-year Treasury and high yield trailed. (Figure 5). We’ve seen a reversal of fortunes as 2019 opens. We believe high yield is positioned to outperform other fixed income sectors in 2019. The investment grade market has seen a deterioration in leverage and debt service metrics as shareholder-friendly stock buyback activity has increased. In contrast, the credit fundamentals of high yield issuers have been steadier overall. Similar to convertible securities, high yield bonds are economically sensitive and can thus benefit in a growing economy. Against this backdrop, we expect defaults in high yield to remain low (below the long-term historical average of 3%), but we could well see an increase in “fallen angels” (bonds that lose their investment grade status). Of course, when it comes to high yield issuers, the details matter greatly. This is why we take a bond-by-bond approach, employing rigorous research to invest where we believe we are well compensated for the risks we undertake.
FIGURE 5. FIXED INCOME REVERSAL OF FORTUNES
Past performance is no guarantee of future results. Source: Morningstar. 10-Year Treasury index is U.S. Treasury, U.S. Corporate High Yield is ICE BofA ML; all other indexes are Bloomberg Barclays. Year to date data as of January 25, 2019.
Conclusion
Although we expect the U.S. and global economies to continue expanding in 2019, the road ahead requires long-term perspective, attention to fundamentals, and a focus on risk management and capital preservation. Markets have delivered a respite in the first weeks of 2019, but volatility is likely to remain elevated. We are confident that this environment sets up well for our active and risk-aware approaches.
This material is distributed for informational purposes only. The information contained herein is based on internal research derived from various sources and does not purport to be statements of all material facts relating to the information mentioned and, while not guaranteed as to the accuracy or completeness, has been obtained from sources we believe to be reliable.
NOT FDIC INSURED | MAY LOSE VALUE | NO BANK GUARANTEE
Indexes are unmanaged, not available for direct investment and do not include fees and expenses. The U.S. Dollar Index measures the value of the U.S. dollar relative to a basket of foreign currencies, including Euro Area, Canada, Japan, United Kingdom, Switzerland, Australia, and Sweden. The Russell 3000 Growth Index and Russell 3000 Value Index measure U.S. growth and value equities, respectively. The Russell 2000 Index measures U.S. small cap stock performance. The S&P 500 Index is considered generally representative of the U.S. equity market. The MSCI All Country ex U.S. Index represents the performance of global equities, excluding the U.S. The MSCI Emerging Markets Index is a measure of the performance of emerging market equities. The ICE BofAML U.S. High Yield Index is an unmanaged index of U.S. high yield debt securities. The ICE BofAML All U.S. Convertible Index (VXA0) is a measure of the U.S. convertible market. The ICE BofAML G300 Index measures the performance of 300 global convertibles. Oil is represented by current pipeline export quality Brent blend. The Bloomberg Barclays U.S. Aggregate Bond Index and Bloomberg Barclays Global Aggregate Index are broad based benchmarks of the U.S. investment grade and global investment grade bond markets, respectively. They include Treasury, government-related, corporate and securitized fixed-rate bonds. The Bloomberg Barclays US Corporate Bond Index measures the investment grade, fixed-rate, taxable corporate bond market. The Bloomberg Barclays Global High Yield Index is a measure of the global high yield debt market. The Underlying Inflation Gauge seeks to capture sustained movements in a broad set of prices, incorporating additional macroeconomic and financial variables. The Global Economic Policy Uncertainty (EPU) Index is a GDP-weighted average of national EPU indices for 20 countries: Each national EPU index reflects the relative frequency of own-country newspaper articles that contain a trio of terms pertaining to the economy (E), policy (P) and uncertainty (U). Source: EconomicPolicyUncertainty.com. ICE Data: Source ICE Data Indices, LLC, used with permission. ICE permits use of the ICE BofAML indices and related data on an `as is’ basis, makes no warranties regarding same, does not guarantee the suitability, quality, accuracy, timeliness, and/or completeness of the ICE BofAML Indices or data included in, related to, or derived therefrom, assumes no liability in connection with the use of the foregoing and does not sponsor, endorse or recommend Calamos Advisors LLC or any of its products or services.
Earnings per share (EPS) is a company’s profit divided by its number of outstanding shares. Price-to-earnings ratio (P/E) is a valuation ratio of a company’s current share price compared to its per-share earnings; forward P/Es are based on forecasted earnings. CAGR, or compounded annual growth rate measures year-over-year growth. Price-to-sales ratio measures a company’s stock price versus its revenues. Fallen angels are investment grade bonds that are downgraded to below investment grade ratings.
Opinions, estimates, forecasts, and statements of financial market trends that are based on current market conditions constitute our judgment and are subject to change without notice. The views and strategies described may not be suitable for all investors. References to specific securities, asset classes and financial markets are for illustrative purposes only and are not intended to be, and should not be interpreted as, recommendations
Calamos Investments LLC
2020 Calamos Court | Naperville, IL 60563-2787
800.582.6959 | www.calamos.com | [email protected]
Calamos Investments LLP
62 Threadneedle Street | London EC2R 8HP
Tel: +44 (0)20 3744 7010 | www.calamos.com/global
©2019 Calamos Investments LLC. All Rights Reserved.
Calamos® and Calamos Investments® are registered trademarks of Calamos Investments LLC.
OUTLKCOM 18698 1218O C


