Signs Of Margin Pressure Ahead
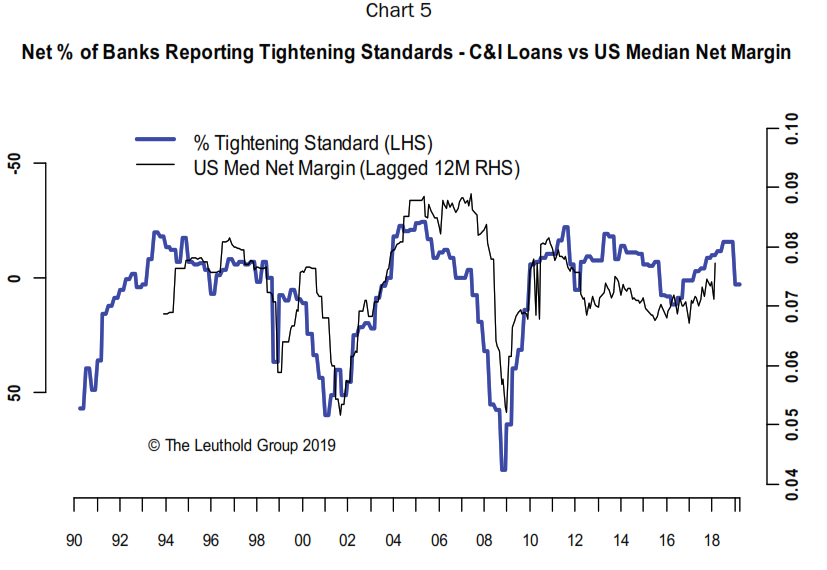
- Banks’ lending standards for C&I loans (typically to large businesses) tightened quite a bit in Q1, which bodes ill for both investment and overall economic growth going forward.
- For equity investors, this also likely means margins will come under pressure down the road.
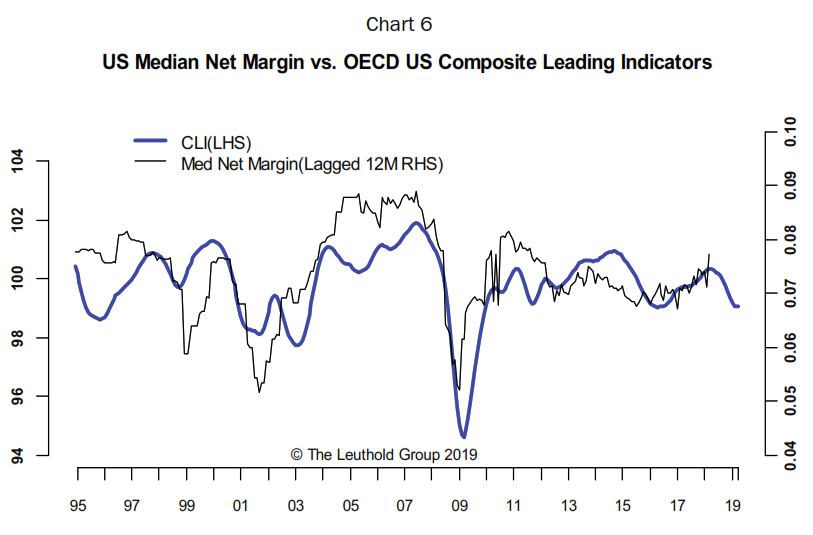
- Besides lending activities, other business-cycle related measures, such as the Leading Indicators and business confidence, likewise show a challenging outlook for profit margins.
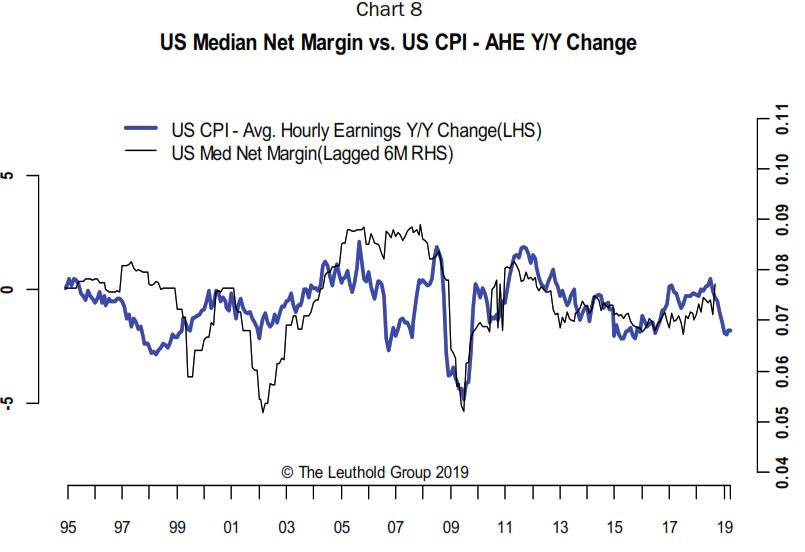
- The difficult inflation dynamic of lower CPI and higher wage inflation is unlikely to support current margins as companies have not been able to pass on wage inflation to consumers.
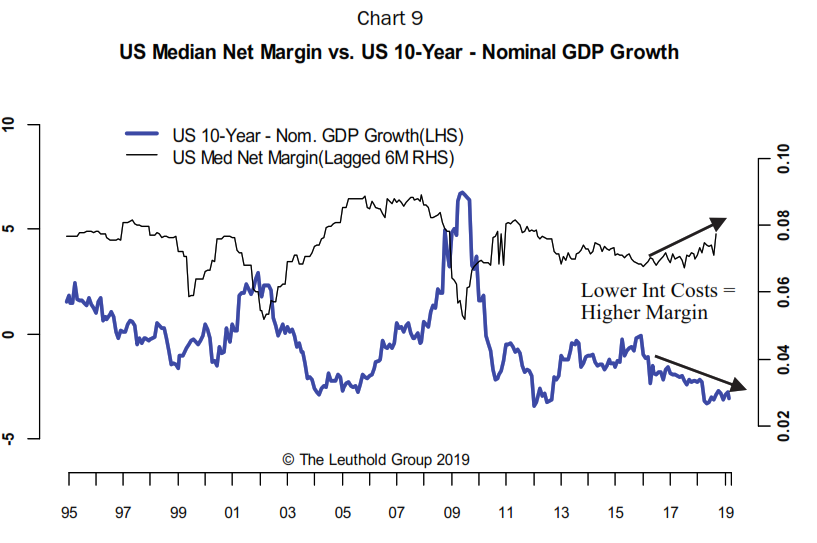
- However, lower real interest costs are perhaps the most positive indicator for profit margins going forward.
- In the near term, the market is supported by much lower earnings expectations.
- But, by year end, there is a bigger challenge—earnings expectations will be high just when margin pressure is likely to resurface.
Risk Aversion Index: Maintains “Lower Risk” Signal
Our Risk Aversion Index ticked lower in April and stayed on the “Lower Risk” signal. Most risky assets participated and the rally was broad-based. The only fly in the ointment is EM assets. The recent weakness in both Chinese stocks and the Yuan is certainly worth paying attention to.
Signs Of Margin Pressure Ahead
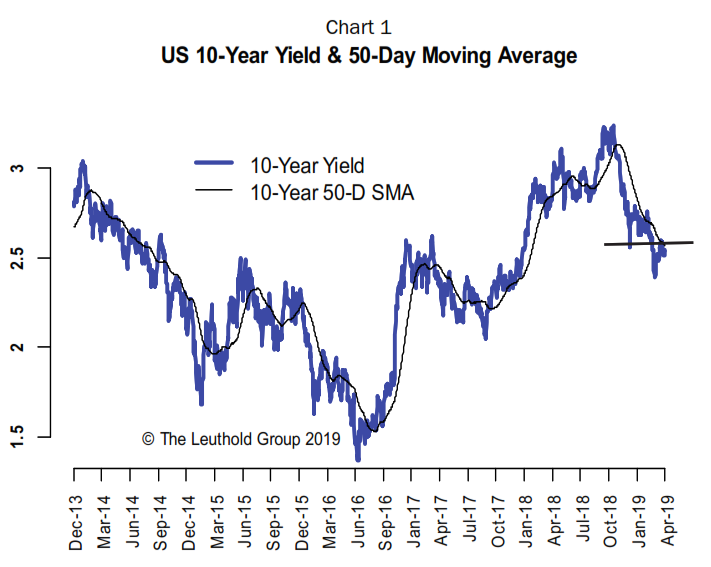
In our last report, we mentioned that March’s big drop in the U.S. 10-year bond yield was too- far too-fast and, in the near term, a partial retracement of that rate decline—perhaps to 260 bps—was to be expected. This played out in April as we projected. The 10-year yield tested the 260 level but failed to break above it and ended the month at 251 bps, about 10 bps higher (Chart 1). We expect the 260 level to remain a barrier for the time being.

We also mentioned that Fed funds’ futures were too quick to price in a rate cut by the end of this year, and we had a sneaking suspicion that the market might be jumping the gun a bit. That’s basically what Powell told the market on May 1st. The market’s immediate reaction was a typical “fear of tightening” move, with both stocks and bonds selling off, yield curve flattening, and the dollar strengthening. While the magnitude of these moves has been rather modest, the message is quite clear: the market still doesn’t want a hawkish Fed.
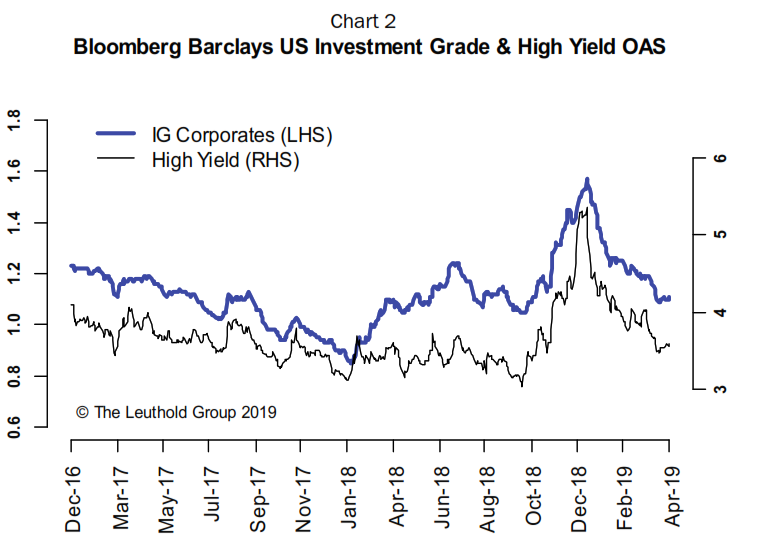
This brings our attention back to the credit market, which has recovered very nicely so far this year from last year’s rout (Chart 2). Longer-dated investment grade credit, which led the spread-widening move in 2018, was one of the earliest signs of market strain caused by Quantitative Tightening and it eventually brought down high yield bonds and stocks in Q4.
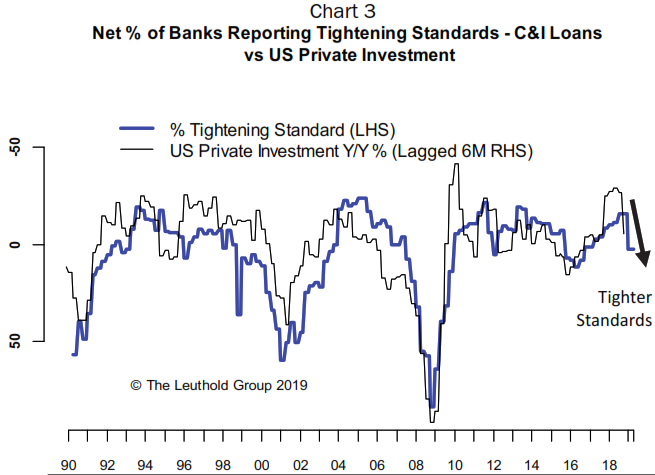
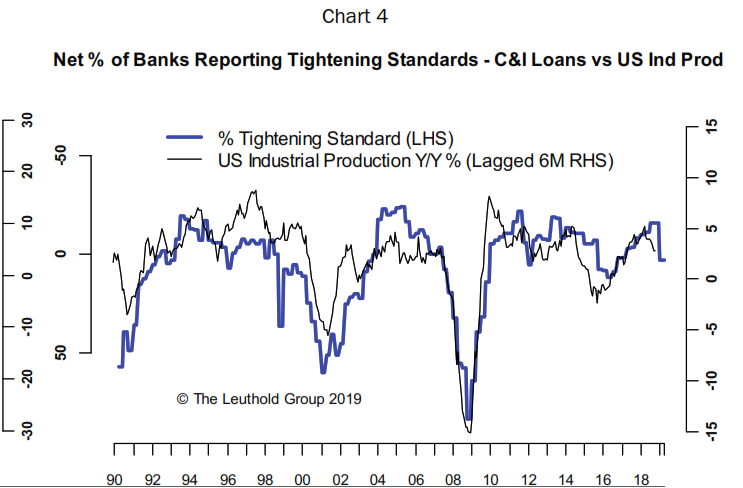
Typically, what happens in the credit market is followed by lending activities. One of the critical data points that didn’t get nearly enough attention was the Fed’s Senior Loan Officer Survey that came out in Q1. Banks’ lending standards for C&I loans (typically to large businesses) tightened quite a bit in Q1, which bodes ill for both investment and overall economic growth going forward (Charts 3 & 4). Private investment and industrial production data seem to have confirmed the ongoing slowdown.
For equity investors, this also means margins will likely come under pressure down the road, albeit with a longer lag, as slower growth eventually weighs on profit margins. Chart 5 shows banks’ tighter lending standards typically lead to margin compression 12 months later. A new Senior Loan Officer Survey is due out in May and we suggest investors keep an eye out for that data. Further deterioration in lending standards will be a big concern.
Besides lending activities, additional business-cycle related measures also have a strong leading tendency for profit margins. Chart 6 shows that the OECD U.S. Composite Leading Indicators (CLI) typically leads U.S. median net margin by 12 months. The recent downturn in the CLI index points to margin pressure later this year.
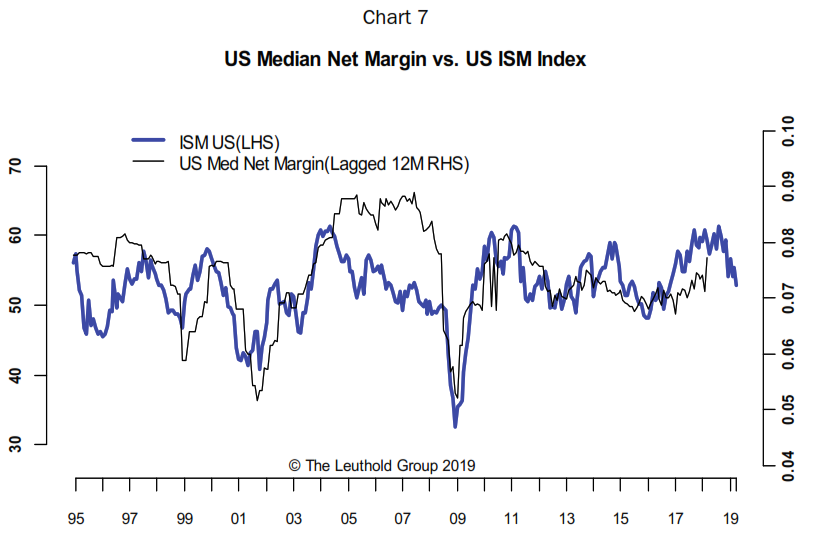
U.S. business confidence has also cooled a bit from very buoyant levels reached a year ago. Trump’s business-friendly policies have provided a big boost to business confidence in the last couple years, but that tailwind has started to fade. The latest report of the U.S. ISM Manufacturing Index, a good proxy for U.S. business confidence badly missed the market consensus. The main components of the ISM index (Price, Employment, New Orders), all undershot expectations and the weakness was broad-based. However, that is not at all surprising to us, as it fits our view that there is a slowdown but no imminent recession.
The strong positive relationship between the ISM index and median net margin on Chart 7 suggests that the macro picture has become harder for companies to sustain the healthy margins they currently enjoy. Note that the recent spike in median net margin has a lot to do with Trump’s new tax cuts, basically the same thing that propelled the ISM index above 60 last year. As with everything, staying at a high level is the real challenge.
One of the challenges that companies face these days to sustain margins is rising wage costs. We are certainly hearing more and more companies complain about rising wages during this earnings season. Indeed, the annual increase in Average Hourly Earnings has gone from 2.5% a year ago to 3.2% currently. While the latest Average Hourly Earnings number was slightly below market consensus and considered a “Goldilocks” scenario, the current uptrend in wages is still very clear. At the same time, the U.S. CPI, a proxy for companies’ top-line pricing power, fell from 2.4% a year ago to less than 1.9% in March. This difficult inflation dynamic is unlikely to support current margins as companies have not been able to pass on wage inflation to consumers. Chart 8 shows a big drop in the CPI-wage inflation spread and that likely means more margin pressure to come later this year.
Besides wages, interest costs definitely deserve an honorable mention. The run-up in interest rates last year looked troublesome on its own. But it’s the real interest cost that truly matters for a company. After all, if higher interest rates can be more than offset by higher top-line growth, there is little to worry about. Indeed, our proxy for real interest costs, the difference between the 10-year yield and nominal GDP growth, showed a very benign trend in real interest costs. Historically, there is a strong negative relationship between real interest costs and net margin (Chart 9). With lower bond yields now, and still decent GDP growth, this is perhaps the most positive indicator for profit margins going forward.
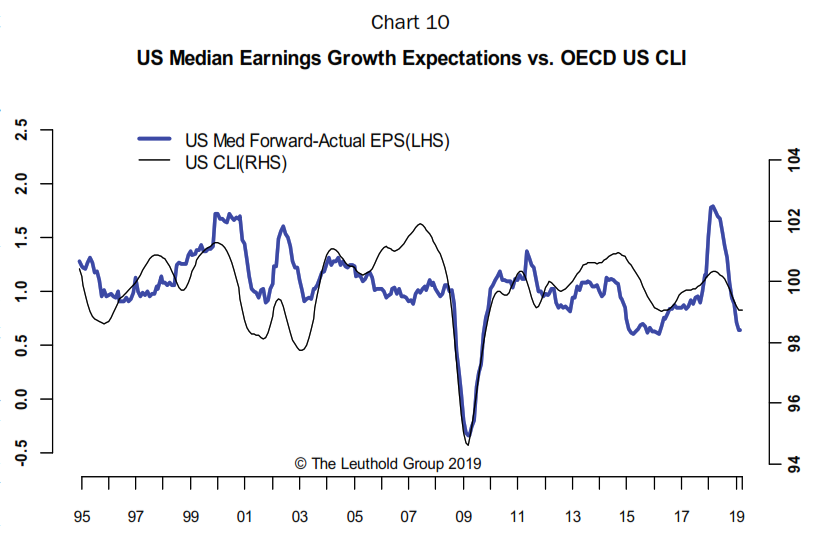
While the medium-term prospect for margins seems problematic, a near-term bright spot for equity investors is earnings expectations, which have come down sharply the last few months. Chart 10 shows median earnings growth expectations have gone from a very stretched all-time high in mid-2018 to near the low end of the historical range. The cyclical nature of earnings expectations is very obvious and it tracks the U.S. CLI index very well over time.
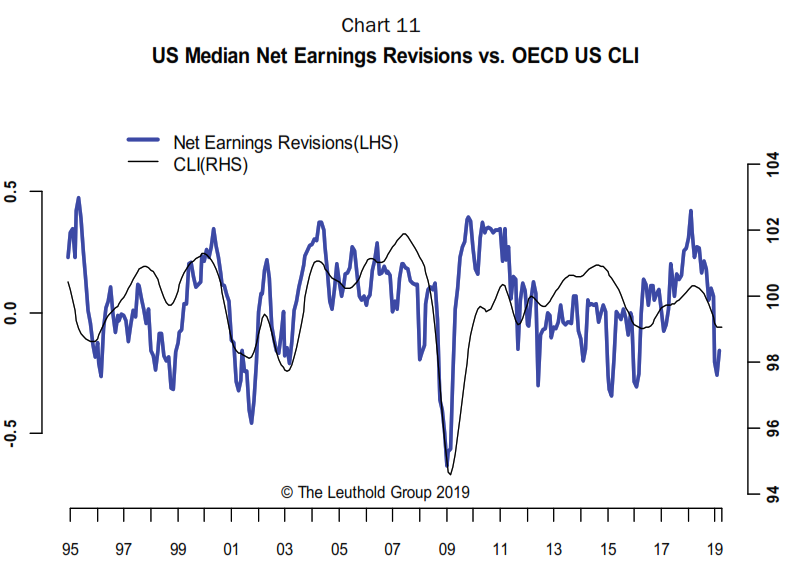
Over the last few months, companies have aggressively lowered their revenue and earnings guidance and analysts have followed suit. Chart 11 shows a big drop in net earnings revisions, measured as (the number of positive revisions less the number of negative revisions)/total number of estimates. Just like earnings expectations, this is more of a concurrent indicator and tracks the overall business cycle well over time.
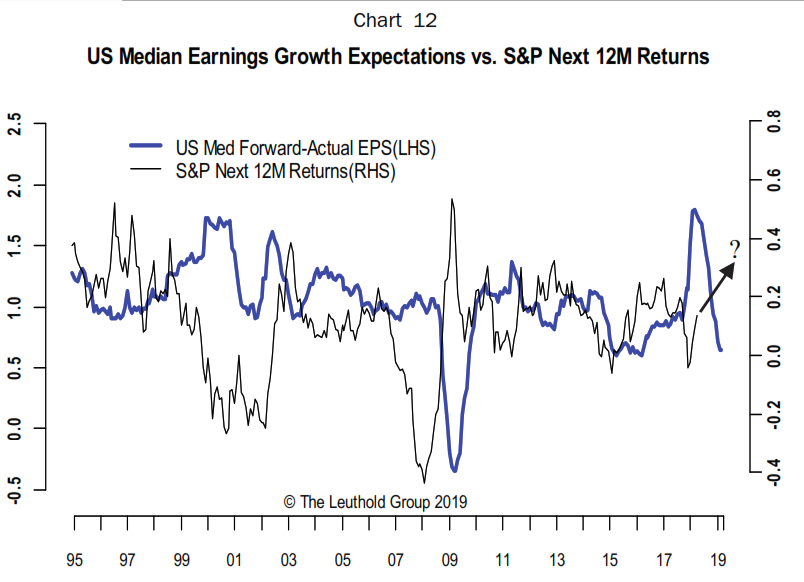
The nice thing about low expectations is that it’s less likely to disappoint. The bar is set so low that most companies can clear it without too much difficulty. That tends to produce good future stock returns, all else being equal. Chart 12 shows a strong negative relationship between median earnings expectations and the S&P 500 next 12-month returns. Current low expectations are supportive for stocks in the near term.
These days, however, a market reversal can be just one tweet away. We have repeatedly warned against the market’s misplaced optimism about an imminent trade deal with China. In our April report, we stated that “our base case is still no meaningful trade deal in the near term, with a major breakthrough only possible in Q4, or later, when the 2020 election season warms up and Trump is more serious about making a deal.” Trump’s latest threat to escalate the trade war with China only reinforced our view.
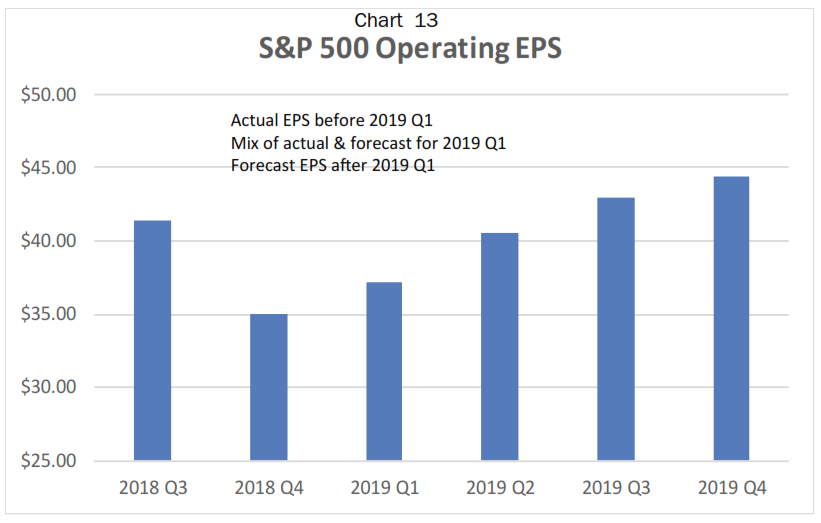
On the positive side, this earnings season has so far been better than expected and analysts are once again expecting a recovery in earnings from the slowdown in Q4 2018 (Chart 13). Based on the S&P data, S&P 500 operating earnings will likely make a new high by the end of 2019. But, this could turn out to be a bigger challenge—earnings expectations will be high six to nine months from now, just when margin pressure is likely to resurface. Having said all this, the market’s attention span is measured in seconds these days. This concern might be too far out to attract enough notice at this point.
© The Leuthold Group
More Fixed Income Topics >