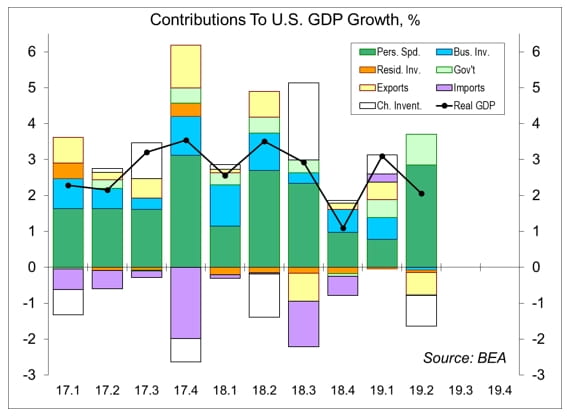
Real (inflation-adjusted) GDP growth rose at a 2.1% annual rate in the advance estimate for 2Q19, a bit better than the median forecast (+1.8%), but growth was concentrated in just two components, consumer spending and government. Everything else was down. GDP growth is rarely even, but the 2Q19 component split raises some important questions.

Click here to enlarge
Personal Consumption Expenditures (consumer spending) account for 68% of Gross Domestic Product. Spending rose at a strong 4.3% annual pace in the second quarter. However, that reflected a rebound from two soft quarters (+1.4% in 4Q18 and +1.1% in 1Q19 – the 4Q18 figure was revised down from +2.5%). Consumer spending rose 2.6% year-over-year in 2Q19, a respectably strong pace, but much less robust than the 4.3% quarterly figure would suggest. Household sector fundamentals remain in good shape. Job growth has slowed this year, but the trend remains beyond a long-term sustainable pace (that is, more than enough to absorb new entrants into the job market). Wage growth has generally picked up, but much less than one would expect given a sub-4% unemployment rate.
As Fed Chair Powell noted in his July 10 monetary policy testimony to Congress, even with the low unemployment rate, there appears to be a lot more slack in the labor market. Moreover, Powell has been particularly impressed by the more recent job gains in areas that had been largely bypassed by the economic recovery.
Business fixed investment fell at a 0.6% annual rate in 2Q19, reflecting a 10.6% decline in business structures (split between commercial, manufacturing, and mining, which includes energy exploration) and a 9.2% drop in transportation equipment (probably Boeing). Is this a slow patch or the start of a prolonged decline? Tariffs and softer global growth have been a factor, but we may also be seeing a pullback from the enthusiasm that followed the corporate tax cut. Business sentiment has deteriorated. Removing trade policy uncertainty would help to shore up business confidence, but the prospects for a near-term resolution seem limited.
Residential fixed investment (homebuilding, improvements, and repairs) has now fallen for six consecutive quarters (and eight of the last nine quarters). Low mortgage rates have helped buyers this year, but affordability issues remain. The housing recovery has matured, but we’ve missed improvement at the lower end of the market, especially start-up homes. Tariffs on lumber, steel, and aluminum, along with a scarcity of skilled labor, have added to construction costs, which are passed along to higher prices of new homes.
Government consumption and investment rose 5.0% in 2Q19, adding 0.85 percentage point to overall GDP growth. This was one of the bigger surprises in the GDP report. Federal nondefense spending rose at a 15.9% annual rate, but that followed a 4.5% decline in 4Q18 and a 5.4% decline in 1Q19.
Quarterly trade figures are squirrelly in the best of times, which makes is difficult to determine the impact of tariffs. The trade deficit had narrowed in 1Q19, adding 0.73 percentage point to GDP growth. That reversed in 2Q19, with net exports subtracting 0.65 percentage point. The May 10 increase in tariffs was expected to impose a greater drag on GDP growth, but it may be some time before we see the full effect. Firms have reported supply chain disruptions. Trade policy uncertainty is a negative factor for business investment.
Inventory growth has been relatively brisk in recent quarters. Recall that the change in inventories contributes to the level of GDP. Hence, the change in the change in inventories contributed to GDP growth. Slower inventory growth subtracted 0.86 percentage point from GDP growth in the advance estimate, and the pace still appears to be elevated relative to final sales. Hence, we should see slower inventories subtracting from growth over the next few quarters.
What does the GDP report mean for Fed policymakers? Not as much as you might think. The Fed has been focused on the cross-currents, trade policy uncertainty and slower growth, but is also worried about the low trend in inflation. The PCE Price Index rose at a 2.3% annual rate in 2Q19 (+1.4% y/y), reflecting higher energy prices. Ex-food and energy, the PCE Price Index rose at a 1.8% (+1.5% y/y, vs. the Fed’s goal of 2.0%). The proximity to the 0% lower bound on interest rates means that the Fed should be more aggressive in cutting rates (than it would be otherwise) if it thinks that is the direction it should take. However, there is no need to panic here and most Fed officials are likely to view a 25-basis-point rate cut as an insurance move, rather than the start of a series.
Data Recap – Earnings reports, mostly mixed, remained the key driver of stock market sentiment. Real GDP rose a bit more than expected in the advance estimate for 2Q19, but components were mixed. A deal on the budget and debt ceiling was reached, clearing a low hurdle for the financial markets (kicking the can down the road was never much in doubt). The IMF downgraded (again) its outlook for global growth. The ECB hinted at easier policy ahead.
The White House and Congress reached a deal on the Federal Budget and Debt Ceiling. The deal raises the FY20-21 budget caps by $320 billion and suspends the debt ceiling through July 2021.
In the latest quarterly update to its World Economic Outlook, the IMF lowered its outlook for global growth to 3.2% in 2019, following downgrades in January and in April. The IMF’s forecast for U.S. growth was raised 0.3 percentage point to 2.6% reflecting stronger than expected growth in 1Q19 and optimism about a further fiscal impact. The IMF continued to note that “risks to the forecast are mainly to the downside.”
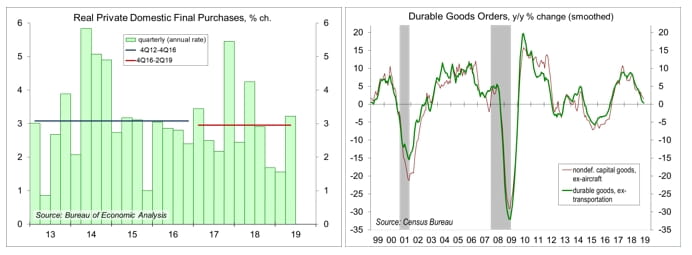
Real GDP rose at a 2.1% annual rate in the advance estimate for 2Q19, vs. +3.1% in 1Q19 (unrevised). Inventories rose at a slower pace, subtracting 0.86 percentage point from overall growth. Net exports (a wider trade deficit) subtracted 0.65 ppt. Private Domestic Final Purchases (which excludes government, inventories, and foreign trade) rose at a 3.2% pace, vs. +1.6% in 1Q19 (revised from +1.3%). Consumer spending rose at a 4.3% annual rate (vs. 1.1% in 1Q19), while business fixed investment fell 0.6% (vs. +4.4%). Residential fixed investment fell 1.5% (vs. -1.0% in 1Q19). Government spending rose 5.0%, adding 0.85 ppt to GDP growth.
Click here to enlarge
Durable Goods Orders rose 2.0% in the initial estimate for June (following -2.8% in April and -2.3% in May), reflecting a 75.5% rebound in civilian aircraft orders). Ex-transportation, orders rose 1.2%. Orders for nondefense capital goods ex-aircraft rose 1.9%. One month does not a trend make, but June’s strength followed a string of relatively soft results in recent months.
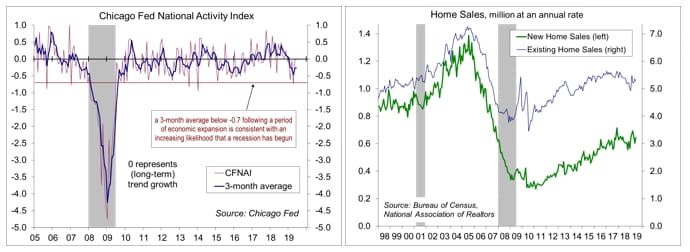
The Chicago Fed National Activity Index was -0.02 in the initial estimate for June, vs. -0.03 in May and -0.73 in April. At -0.26, the three-month average was consistent with below-trend growth in the near term, although that largely reflects significant weakness in the April data.
Click here to enlarge
New Home Sales rose 7.0% (±15.2%), to a 646,000 seasonally adjusted annual rate in June (+4.5% y/y, ±21.8%). Improvement was concentrated in the West, which rebounded after falling sharply in May. Unadjusted sales for 2Q19 were flat y/y (Northeast -30.0%, Midwest -13.0%, South +3.0%, West +8.9%).
Existing Home Sales fell 1.7%, to a 5.27 million seasonally adjusted annual rate in June (-2.2% y/y). Job growth, low mortgage rates, and wealth gains are favorable, but affordability and a lack of mid-to-lower priced inventory remain important restraints. Unadjusted sales for 2Q19 were down 2.3% from 2Q18 (Northwest -2.9%, Midwest -3.9%, South 0.0%, West -4.9%).
The European Central Bank’s Governing Council left short-term interest rates unchanged, but “stands ready to adjust all its instruments as appropriate, to ensure that inflation moves towards its aim in a sustained manner.”
To learn more about the risks and rewards of investing in fixed income, please access the Securities Industry and Financial Markets Association’s “Learn More” section of investinginbonds.com, FINRA’s “Smart Bond Investing” section of finra.org, and the Municipal Securities Rulemaking Board’s (MSRB) Electronic Municipal Market Access System (EMMA) “Education Center” section of emma.msrb.org.
The author of this material is a Trader in the Fixed Income Department of Raymond James & Associates (RJA), and is not an Analyst. Any opinions expressed may differ from opinions expressed by other departments of RJA, including our Equity Research Department, and are subject to change without notice. The data and information contained herein was obtained from sources considered to be reliable, but RJA does not guarantee its accuracy and/or completeness. Neither the information nor any opinions expressed constitute a solicitation for the purchase or sale of any security referred to herein. This material may include analysis of sectors, securities and/or derivatives that RJA may have positions, long or short, held proprietarily. RJA or its affiliates may execute transactions which may not be consistent with the report’s conclusions. RJA may also have performed investment banking services for the issuers of such securities. Investors should discuss the risks inherent in bonds with their Raymond James Financial Advisor. Risks include, but are not limited to, changes in interest rates, liquidity, credit quality, volatility, and duration. Past performance is no assurance of future results.
© 2019 Raymond James Financial, Inc. All rights reserved.
© Raymond James
Read more commentaries by Raymond James