More than 2.7 million travelers on 44,000 flights travel across the United States each day – a figure that has increased every year since 2008. According to S&P Global Ratings, nearly 45 percent of all Americans took a commercial flight in 2018 and 42 percent of U.S. citizens now own a passport, compared with just 15 percent in 1997. Demand shows no signs of stopping, with this summer expected to set a record of 10 years of consecutive growth.
Just take a look at the chart below. Domestic air traffic has increased an average of 2.2 percent annually since 2002 – with only two years of declines in 2008 and 2009. Both domestic and international enplaned passengers set a record in 2018 for a total of more than 1 billion flyers.

click to enlarge
How have carriers and airports kept up with passenger demand?
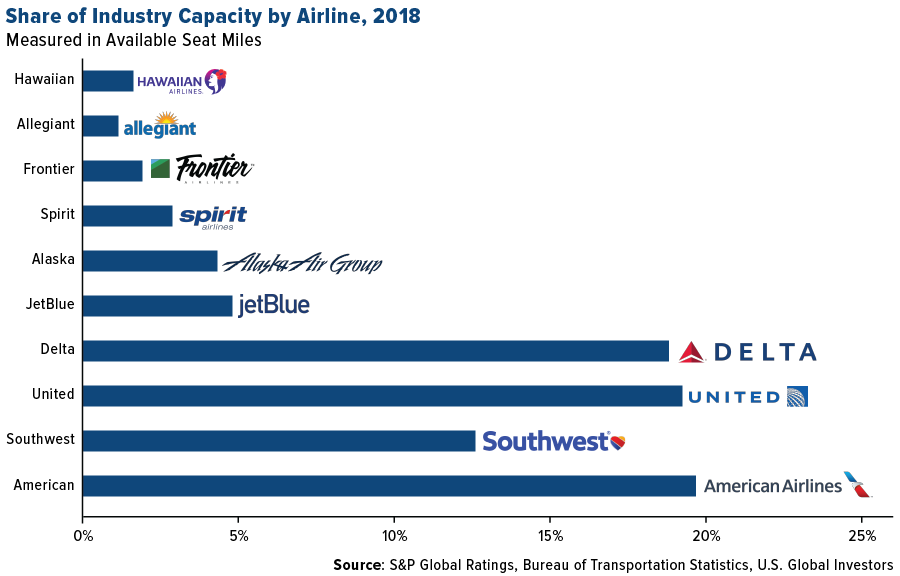
Carriers have added more capacity. With the exception of JetBlue Airways and Spirit Airlines, capacity, as measured by seats on all domestic carriers, is up from 2018. The big four airlines – United, Delta, American and Southwest – as seen in the chart below, account for more than 81 percent of domestic airline capacity.
Mainline carriers have actually decreased flights while increasing seat capacity. On the other hand, ultra-low cost carriers – such as Allegiant, Frontier and Spirit – have grown the number of flights by 91 percent. In 2013, about 29 percent of the U.S. domestic market was exposed to ultra-low cost carriers. In just five years that figure has expanded to 56 percent in 2018.
click to enlarge
Are Airports Expanding Alongside Passenger Growth?
Along with many of the nation’s roads and highways, airport infrastructure is showing its age. Airports Council International-North America (ACI-NA) estimates that over $114 billion is needed for projects from 2019-2023 for large, medium and small airports. This figure is an increase of more than 30 percent from the 2017 to 2021 estimate.
The 30 largest airports account for 72 percent of passenger volume and 71 percent of identified capital needs – or $81.1 billion. Many of the biggest airports have enough runway capacity. The real challenge is adding more terminal space to accommodate a greater number of travelers. Kurt Forsgren of S&P Global writes that “with runway capacity largely built out at key hubs, the large majority of needs are on the landside, including terminal development and investments to move people to and through often site-constrained airports facilities.”
click to enlarge
Airport Credit Ratings Become More in Focus
Airports are funded largely through federal airport or state capital grants, passenger facility charges (PFC) and municipal bonds secured by airport revenues from airlines fees and concessions. ACI-NA identified that over 50 percent of airport needs are for terminals. However, this type of construction is not eligible for federal grants. This means moving forward a larger proportion of airport construction will be financed through debt, making an airports’ credit rating a big focus.
Additionally, the PFC has been capped at $4.50 since 2000 – despite airports lobbying Congress to raise the tax. Although this charge did generate $3.6 billion across the U.S. airport system in 2018, the purchasing power of the $4.50 has, of course, eroded over time. By comparison, luggage charges generated an estimated $1 billion more at $4.9 billion in 2018.
“As the debt, liabilities, and cost structures at U.S. airports increase, fewer airlines generate the fees airports collect through rates and charges, meaning the airports rely more on non-aeronautical revenues from concessions.”
Being more leveraged through debt does add a higher risk when investing in airports. However, S&P Global Ratings did find that an increase in passengers has mitigated debt levels so far and that they “expect the sector can accommodate the higher debt levels and leverage.”
All opinions expressed and data provided are subject to change without notice. Some of these opinions may not be appropriate to every investor.
The Passenger Facility Charge (PFC) is a tax each passenger pays for passing through an airport.
Holdings may change daily. Holdings are reported as of the most recent quarter-end. The following securities mentioned in the article were held by one or more accounts managed by U.S. Global Investors as of (06/30/2019): JetBlue Airways Corp, Spirit Airlines Inc, United Airlines Holdings Inc, Delta Air Lines Inc, American Airlines Group Inc, Southwest Airlines Co, Alaska Air Group Inc, Allegiant Travel Co, Hawaiian Holdings Inc.
© U.S. Global Investors
© U.S. Global Investors
Read more commentaries by U.S. Global Investors