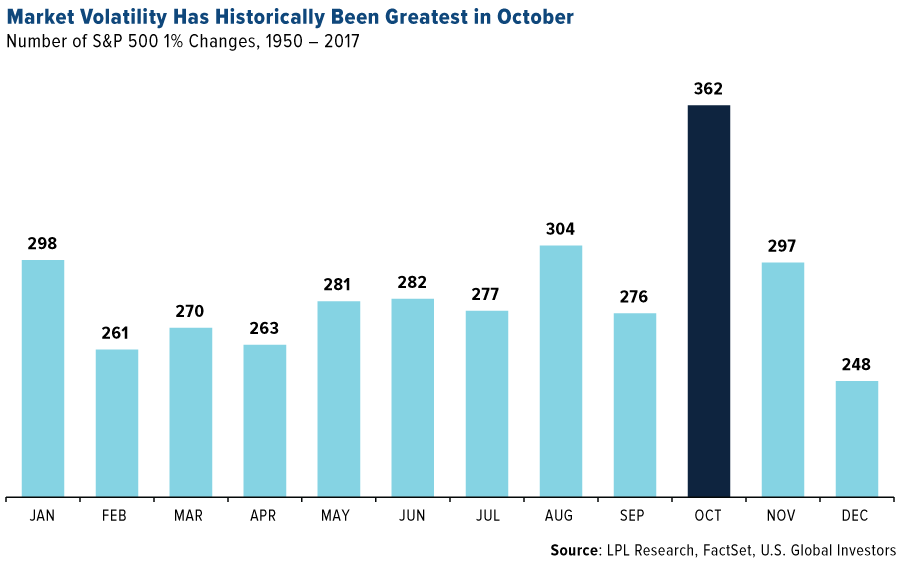
For reasons unknown, October has historically been the most volatile month for the stock market—by a goodly margin. Between 1950 and the end of 2017, the S&P 500 Index saw as many as 362 trading days during the month of October in which the market moved up or down more than 1 percent. That’s 58 more days than the second-most volatile month, August.

click to enlarge
When I say “for reasons unknown,” I really mean it. Though many have tried, nobody’s been able to give a satisfactory explanation as to why October can’t just straighten up and fly right like its 11 siblings. Presidential election uncertainty, quarterly reporting, seasonality cycles—they’ve all crumbled under close scrutiny.
And yet the “jinx month,” as it’s been nicknamed, has given us some of the very worst market crashes in history, including those in 1929 and 1987. Last year, October marked the start of a year-end selloff, with stocks plunging nearly 7 percent. In the first week of this October, the S&P 500 ended down more than 1 percent for two straight trading sessions.
Could the volatility be nothing more than a self-fulfilling prophecy? That’s the theory of Mark Hulbert, founder of the Hulbert Financial Digest. In a Wall Street Journal op-ed this week, Hulbert suggests that, because October is known for its wild mood swings, some investors may end up making rash decisions and “jinxing” themselves.
“Their expectation [of higher volatility] will cause premiums on both call and put options to increase,” he writes. “That in turn will lead to a jump in the CBOE’s Volatility Index, or VIX, since it is calculated based on those premiums.”
I think this is as good an explanation as any I’ve heard before.
An Asset Class With a History of “Calm” Performance
Whatever the cause, volatility is just something investors have no other choice than to manage. One of my favorite ways to do this, aside from gold, is with municipal bonds.
Like gold, municipal bonds won’t make you rich. But they serve two very important purposes in your portfolio: 1) They produce tax-free income at the federal and often state and local levels, and 2) They can help minimize the volatility in your equity position.
Fixed income in general has a history of being less volatile than stocks, but muni bonds in particular have been shown to experience less “drama” than Treasuries and corporate debt. They’ve tended to be less sensitive to interest rate uncertainty, especially when they’re on the short end of the yield curve.
I believe this makes munis attractive to investors who are seeking not only tax-free income but also a measure of “calmness.”
A Record Setting Year for Inflows?
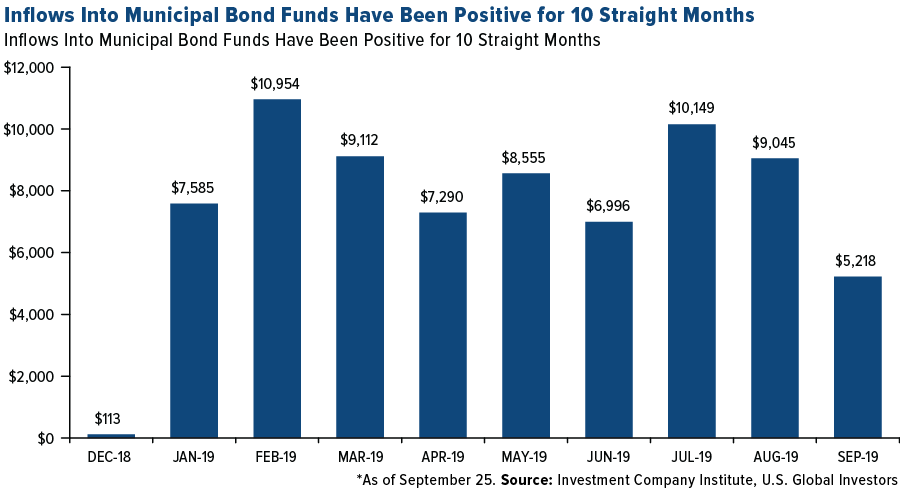
With volatility on the rise, munis are in high demand. Net inflows into mutual funds and ETFs that invest in municipal debt were positive for the 10th straight month in September. “With $70.7 billion collected for the year to date, 2019 remains on pace to be a record-setting year for municipal bond inflows,” Morningstar wrote in its August report.
click to enlarge
Some may call munis boring, but global risks are mounting, and a little “boring” could be a welcome addition to your portfolio.
Without compromising modest growth, we’ve managed to keep NEARX volatility in check by focusing on high-quality, investment-grade muni bonds with relatively short maturities. NEARX has historically shown a greater likelihood of dodging the dramatic swings the equity market has often experienced in times of uncommonly high volatility, such as what we saw in the first decade of the century.
Please consider carefully a fund’s investment objectives, risks, charges and expenses. For this and other important information, obtain a fund prospectus by visiting www.usfunds.com or by calling 1-800-US-FUNDS (1-800-873-8637). Read it carefully before investing. Foreside Fund Services, LLC, Distributor. U.S. Global Investors is the investment adviser.
Bond funds are subject to interest-rate risk; their value declines as interest rates rise. Though the Near-Term Tax Free Fund seeks minimal fluctuations in share price, it is subject to the risk that the credit quality of a portfolio holding could decline, as well as risk related to changes in the economic conditions of a state, region or issuer. These risks could cause the fund’s share price to decline. Tax-exempt income is federal income tax free. A portion of this income may be subject to state and local taxes and at times the alternative minimum tax. The Near-Term Tax Free Fund may invest up to 20% of its assets in securities that pay taxable interest. Income or fund distributions attributable to capital gains are usually subject to both state and federal income taxes. Diversification does not protect an investor from market risks and does not assure a profit.
A call option is an option to buy assets at an agreed price on or before a particular date. A put option is an option to sell assets at an agreed price on or before a particular date.
The CBOE Volatility Index (VIX) is a real-time market index that represents the market’s expectation of 30-day forward-looking volatility. Derived from the price inputs of the S&P 500 Index options, it provides a measure of market risk and investors’ sentiments. The S&P 500 Index or the Standard & Poor's 500 Index is a market-capitalization-weighted index of the 500 largest U.S. publicly traded companies. The S&P is a float-weighted index, meaning company market capitalizations are adjusted by the number of shares available for public trading.
© U.S. Global Investors
© U.S. Global Investors
Read more commentaries by U.S. Global Investors