Consumer price inflation was moderate in 2019, as gasoline prices stopped falling. The tight labor market has led to some upward pressure on wages, but constraints have dampened output is some areas. Growth in real (that is, inflation-adjusted) hourly earnings has slowed sharply in recent months, which ought to dampen consumer spending growth.
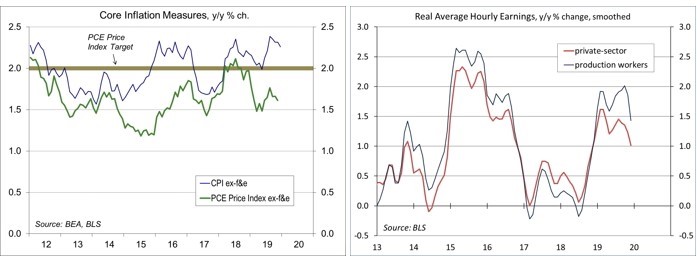
The Consumer Price Index rose 2.3% in 2019, both overall and excluding food and energy. The year-over-year increase in the core PCE Price Index, the Fed’s chief inflation gauge, has been trending 0.6 to 0.7 percentage points lower (1.6% y/y in November, December data due January 31). Why the gap? The two use mostly the same components, but the weights and formula differ. The PCE accounts for the substitution of cheaper goods (among similar goods) when there is a relative price change (such as between different types of apples). In medical care, the CPI only covers out- of-pocket expenditures. The PCE Price Index includes employer provided insurance.
The Fed’s goal is 2% inflation in the PCE Price Index, and it has fallen short of that goal in recent years. There is concern that if the Fed continues to fall short of the 2% goal, inflation expectations will fall below 2%, making it harder for the Fed to reach the 2% goal. Currently, monetary policy attempts to balance the risk of prolonged sub-2% inflation with the risk of inflating an asset bubble. No change in monetary policy is expected until there is a material change in the economic outlook.

Click here to enlarge
Despite a tight job market, wage gains have remained relatively moderate overall. The Phillips Curve, the trade-off between lower unemployment and higher wage inflation, is not dead. However, there’s a growing consensus that the curve is relatively flat around the natural rate of unemployment and only picks up sharply when the unemployment rate is more than a full percentage point below the natural rate. Views on the natural rate differ, and the rate ought to vary over time, falling as the population ages. Federal Reserve officials pegged it at 3.5% to 4.5% in December, with most at around 4.1%). State and local minimum wage increases are expected to boost average hourly earnings in early 2020, but moderately (the federal minimum wage remains at $7.25, unchanged for over a decade).
With gasoline prices stabilizing, year-over-year growth in real average hourly earnings has slowed (+2.0% y/y in September and October, +0.6% y/y in December). With job growth slowing and purchasing power rising more moderately, we should see a slowing in the pace of consumer spending growth in 2020 – still moderate, but lower than in 2019. That’s not a bad outlook, but slower growth may leave the U.S. economy more vulnerable to shocks.
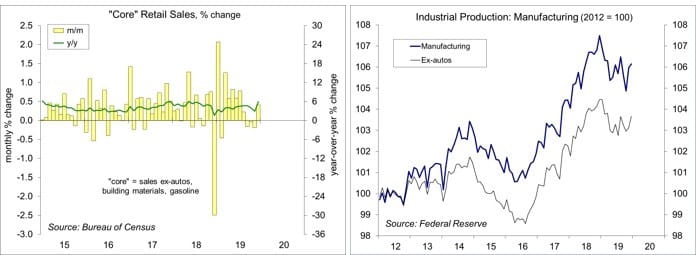
Consumer spending growth is rarely smooth even across time. Quarterly variation is typical. Spending growth was unusually slow in late 2018 and early 2019 (likely reflecting trade policy uncertainty and the government shutdown), with stronger growth in 2Q19 and 3Q19. The December retail sales data suggest a slowing in 4Q19, although results appear strong in comparison to the weakness of a year ago. Consumer spending growth is almost certain to be uneven across 2020, but the underlying trend should be moderate.
Data Recap – The initiation of impeachment proceedings in the Senate did not matter much to investors. Neither did the economic data reports, which were mixed.
President Trump and Chinese Vice Premier Liu He signed a Phase 1 Trade Deal. The agreement refrains from imposing additional tariffs, but leaves in place most of the tariffs on industrial supplies and materials and intermediate products. Import goals for China appear unrealistic and it’s unclear how the bargain will be enforced.
The Fed’s Beige Book noted that “economic activity generally continued to expand modestly in the final six weeks of 2019.” Employment was “steady to rising modestly” in most districts, as “widespread labor shortages” constrained job growth, “and in a few cases, business expansion.” Wage growth was characterized as “modest to moderate,” with some impact from higher minimum wages.
Retail Sales rose 0.3% in the advance estimate for December (+5.8% y/y). Motor vehicle sales slipped 1.3% (+4.1% y/y). Gasoline sales rose 2.8% (+11.3% y/y). Sales of building materials and garden supplies rose 1.4% (+2.0% y/y). Ex-autos, building materials, and gasoline, sales rose 0.4% (+6.0% y/y), following declines over the three previous months, down at a 0.2% annual rate in 4Q19 (vs. +6.3% in 3Q19).
Business Inventories fell 0.2% in November (+2.8% y/y), partly reflecting the GM strike. Business sales rose 0.7% (+1.0% y/y). Ex-motor vehicles, inventories edged up 0.1% (+3.0% y/y), while sales rose 0.5% (+0.6% y/y).
Click here to enlarge
Industrial Production fell 0.3% in December (-1.0% y/y), reflecting a 5.6% drop in the output of utilities (-1.9% y/y, apparently reflecting unseasonably warm temperatures). Mining rose 1.3% (+1.4% y/y), with oil and gas well drilling down 0.7% (-24.0% y/y). Energy extraction rose 1.6% (+7.6% y/y). Manufacturing output rose 0.2% (-1.3% y/y), restrained by a 4.6% drop in motor vehicle production (-8.3% y/y). Ex-motor vehicles, factory output rose 0.5% (-0.8% y/y).
The Consumer Price Index rose 0.2% in December (+2.3% y/y). Gasoline prices rose 2.8% (+7.9% y/y). Ex-food & energy, the CPI rose 0.1% ex-food & energy (also +2.3% y/y). Note that the Fed uses the PCE Price Index as its official target, which has a smaller weighting on shelter, and has been trending about 0.6-0.7 percentage point below the core CPI y/y in recent months.
Real Hourly Earnings edged down 0.1% in December (+0.6% y/y, vs. +2.0% y/y in September and October). For production workers, real earnings slipped 0.2% (+0.7% y/y).
The Producer Price Index rose 0.1% in December (+1.3% y/y). Ex-food, energy, and trade services, the PPI rose 0.1% (+1.5% y/y).
Import Prices rose 0.3% in December (+0.5% y/y), unchanged excluding food and fuels (-1.3% y/y). The data do not include tariffs.
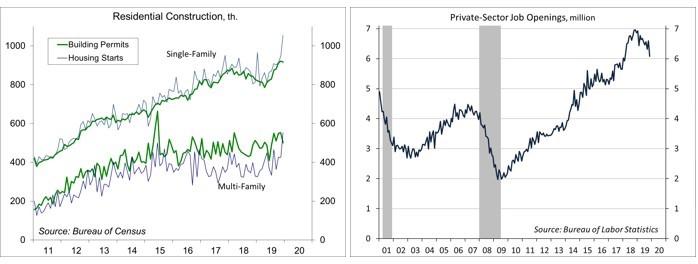
Building Permits fell 3.9% in December, to a 1.416 million seasonally adjusted annual rate (+5.8% y/y). Single-family permits edged down 0.5% (+10.8% y/y). Unadjusted single-family permits for 4Q19 rose 9.3% y/y (-11.0% in the Northeast, +6.3% in the Midwest, +10.8% in the South, and +12.9% in the West). Housing Starts jumped 16.8% (reported accurate to ±12.8%), to a 1.608 million pace (+40.8% y/y).
Click here to enlarge
Job Openings fell to 6.80 million in November (6.08 million for the private sector), trending down since October 2018. The level remains high by historical standards. Hiring rates and quit rates have been little changed over the last year
Jobless Claims fell to 204,000 in the week ending January 11. The peak in unadjusted claims (which spike at the start of the year) has continued to trend lower over the last several years. At 216,250, the four-week average remains very low by historical standards.
The opinions offered by Dr. Brown should be considered a part of your overall decision-making process. For more information about this report – to discuss how this outlook may affect your personal situation and/or to learn how this insight may be incorporated into your investment strategy – please contact your financial advisor or use the convenient Office Locator to find our office(s) nearest you today.
All expressions of opinion reflect the judgment of the Research Department of Raymond James & Associates (RJA) at this date and are subject to change. Information has been obtained from sources considered reliable, but we do not guarantee that the foregoing report is accurate or complete. Other departments of RJA may have information which is not available to the Research Department about companies mentioned in this report. RJA or its affiliates may execute transactions in the securities mentioned in this report which may not be consistent with the report's conclusions. RJA may perform investment banking or other services for, or solicit investment banking business from, any company mentioned in this report. For institutional clients of the European Economic Area (EEA): This document (and any attachments or exhibits hereto) is intended only for EEA Institutional Clients or others to whom it may lawfully be submitted. There is no assurance that any of the trends mentioned will continue in the future. Past performance is not indicative of future results.
© Raymond James
© Raymond James
More Alternative Investments Topics >