Indiscriminate Selling Has Driven Closed-end Fund Discounts, Creating Compelling Value
Membership required
Membership is now required to use this feature. To learn more:
View Membership BenefitsSummary of Key Views
- The closed-end fund market, along with other financial markets in general, has experienced an enormous amount of stress over the past several weeks. Market volatility is extreme by any measure. Many funds have well underperformed relative to the assets in their respective underlying portfolios. This has caused much consternation about the vehicle.
- With all of the benefits attributable to the product, such as intraday trading, benefits of low financing costs of leverage, ability to be fully invested, consistent source of income, there are some idiosyncrasies in closed-end funds that can present challenges, especially during times of extreme market volatility.
- CEFs are often the first source for cash during times of market stress. Because there is significantly less interest in these products from institutional investors, these markets may at times trade at discounts, sometimes wide ones, due to a lack of value buyers to take advantage of large and frankly irrational price/NAV differences during periods of market stress. It is the rapid divergence of the CEF market price relative to its corresponding NAV that occurs when many retail investors sell en masse. That is exactly what we are seeing today: indiscriminate selling.
- Dislocations similar to today have happened previously, followed by strong recoveries. While CEFs should not be viewed as trading vehicles, today’s discounts on closed-end funds present compelling entry points.
Dislocations Have Occurred, Followed by Recoveries
Unlike publicly traded vehicles, such as stocks or many fixed income investments, as well as ETFs, financial buyers and sellers of CEFs tend to be overwhelmingly made up of retail investors. In addition, because of increasingly limited research available on the subject and lack of research coverage of most of the funds that are in the market, prices of CEFs are susceptible to wide swings and pressure during extremely volatile markets, like the ones that we are experiencing now.
We have been here before. It doesn’t necessarily take a “Black Swan” event, such as what we are witnessing, to cause these dislocations in the CEF market. They may have similar, if not as dramatic, reactions during lesser and more common periods of volatility.
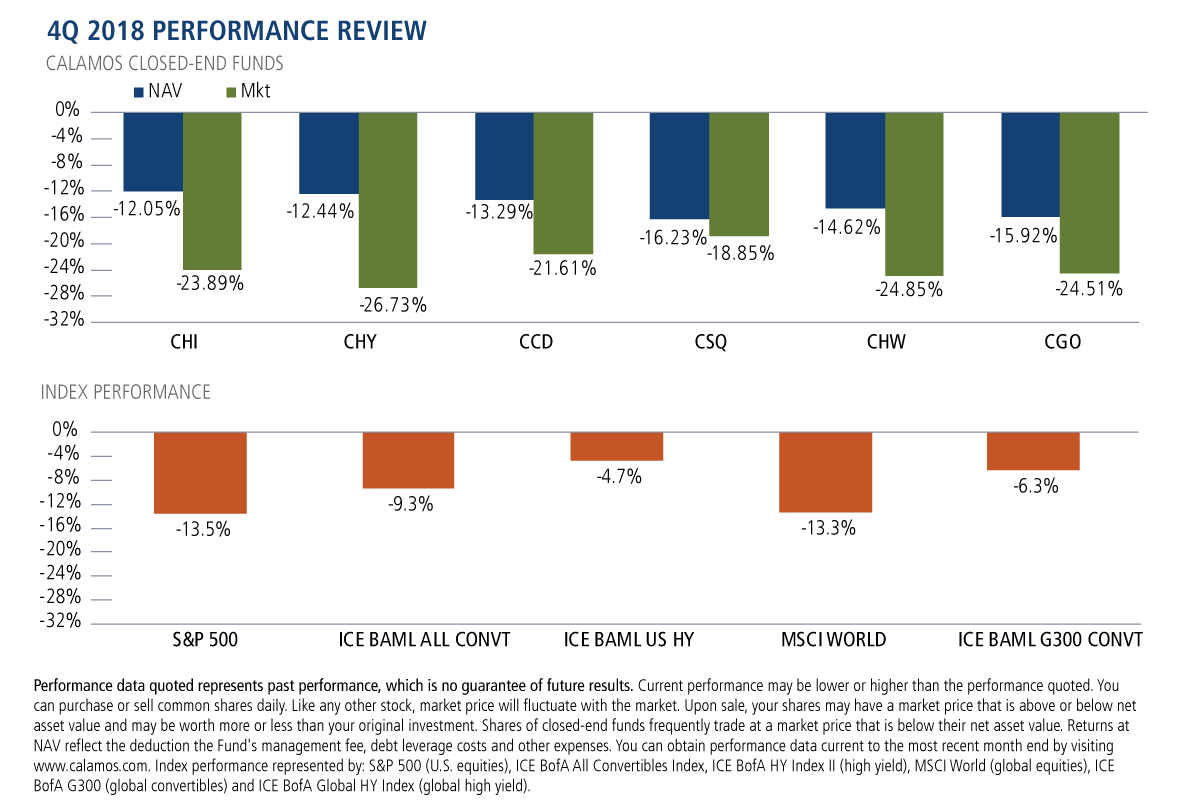
We saw that very dynamic 18 months ago in the quarter of 2018, a volatile period going into the year’s end. Although the CEF NAVs generally held up respective of their respective benchmarks, the prices did not.
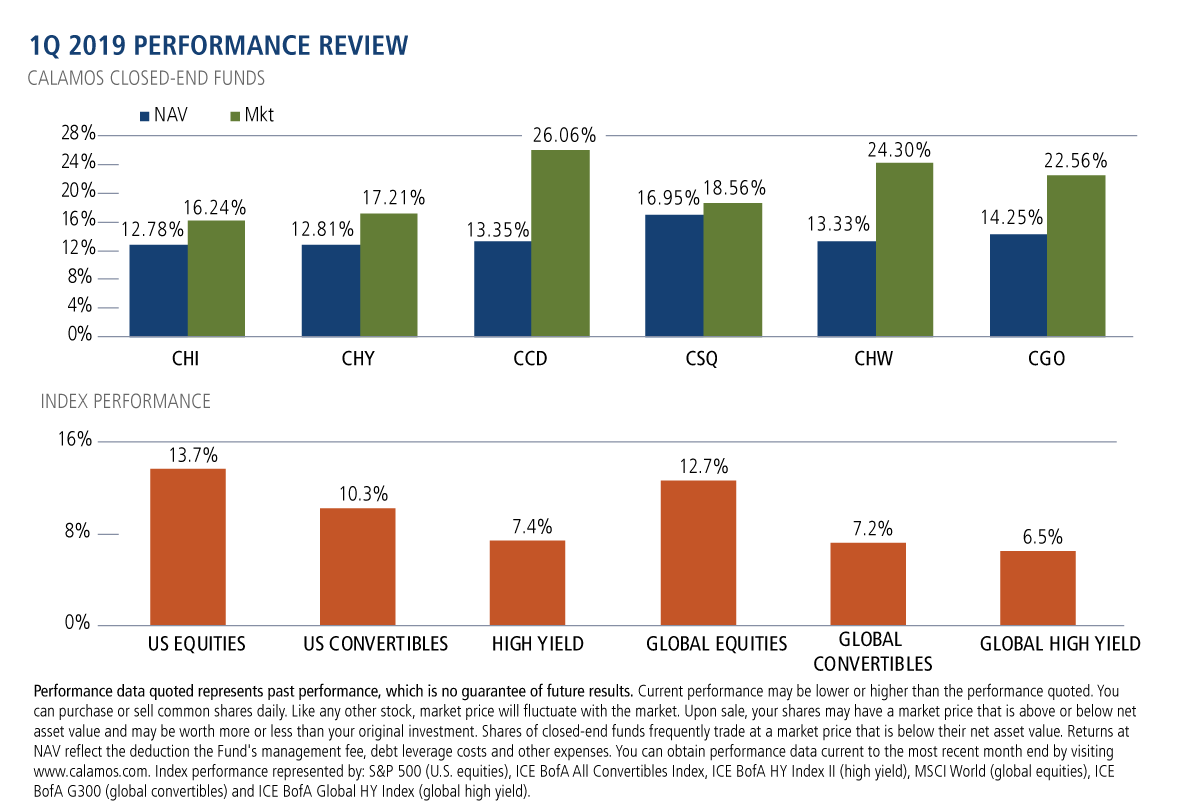
When the equity market started to rebound in the first quarter of 2019, the underlying NAVs of the CEFs generally recovered in line, some even more so. However, the CEF stock prices during this time began to make up for the disproportionate losses relative to their respective NAVs in Q4 2019 by markedly outperforming.
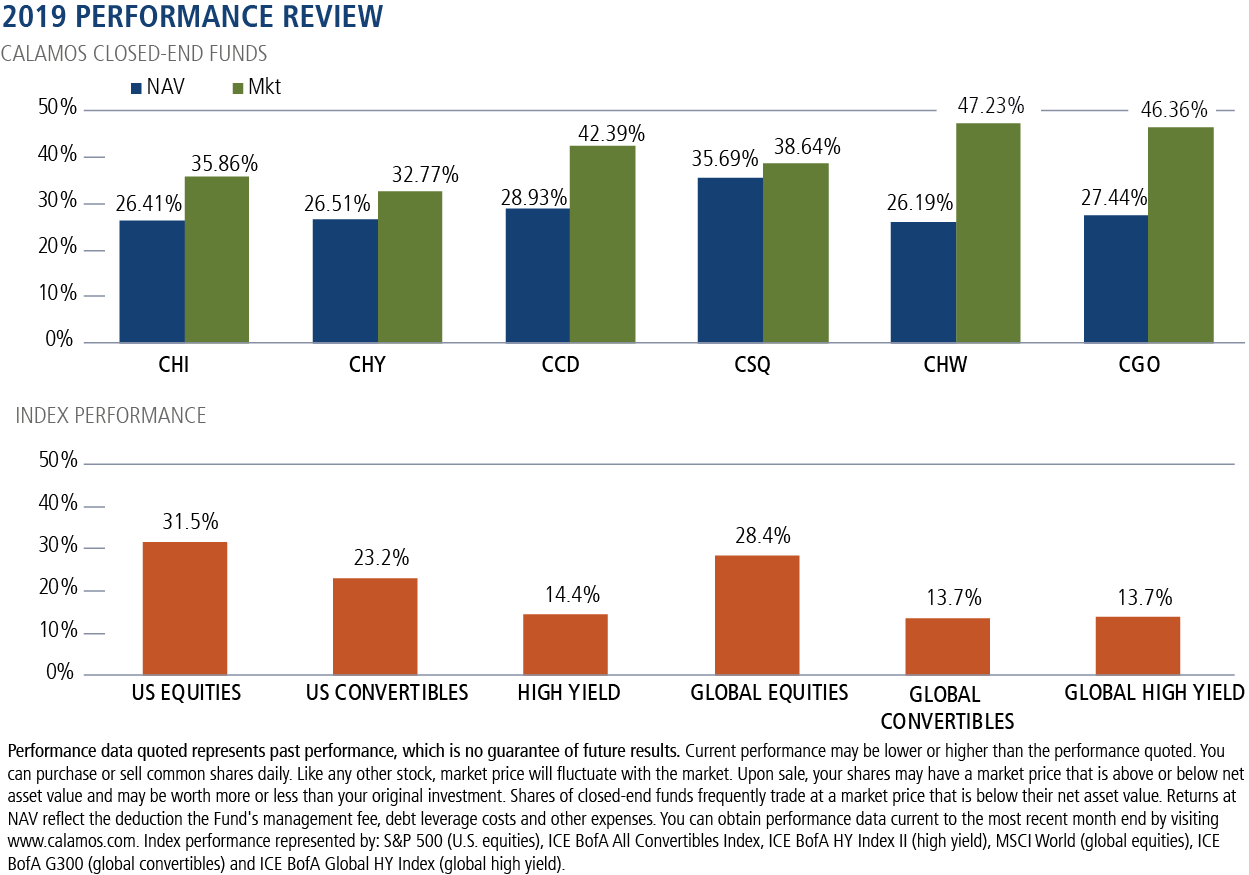
As the equity markets continued to recover in 2019, CEF stock prices continued to outperform the NAVs throughout, with many funds offering returns on price for 2019 at levels nearly double that of their respective NAVs for the year.
In a more extreme example, more similar in magnitude to what we are experiencing today, such was also the case during the financial crisis of 2008, when discounts in some funds exceeded 50% as stocks grossly outperformed relative to declining NAVs. But, the price improvements in 2009 more than made up for the NAV declines during 2008.
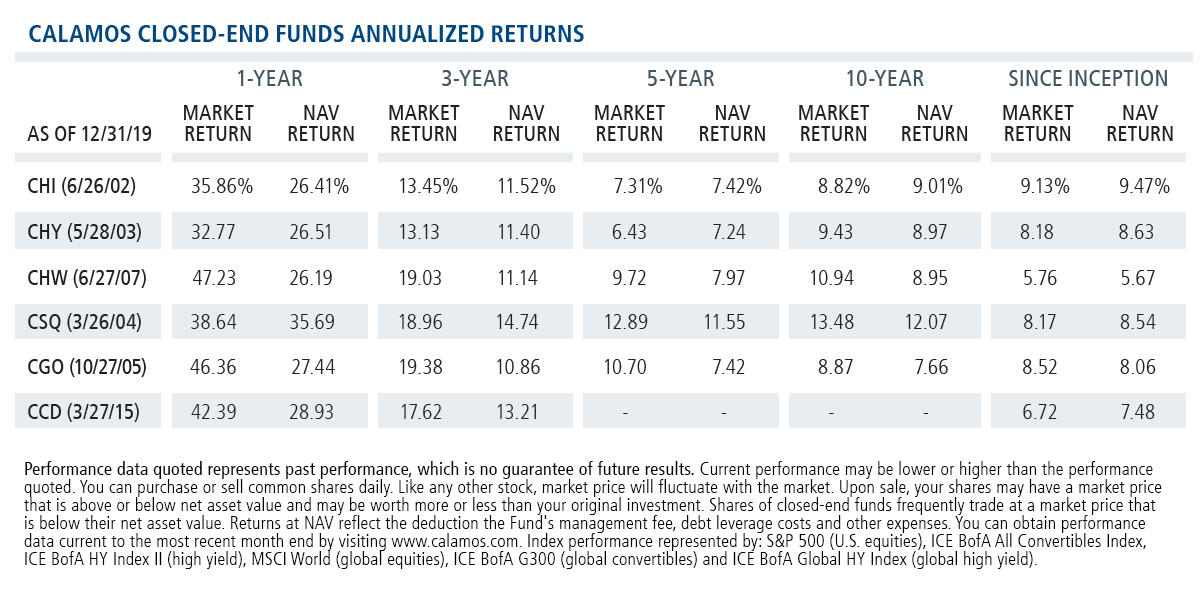
For example, our largest fund, the Calamos Strategic Total Return Fund (CSQ), which focuses on total return through investment primarily in U.S. equities, saw its NAV decline by approximately 45% during the financial crisis of 2008. This compared to a decline in the S&P 500 of approximately 37% that year.
However, its price declined approximately 49% during the period. The fund‘s discount peaked at 32% in October of 2008. When the market recovered in 2009, with the S&P 500 regaining approximately 37%, CSQ’s NAV rebounded by 47%. Its stock price soared more than 55%.
Over the 2008-2009 period, the S&P 500 returned -11% while the NAV and price of CSQ returned +3% and +6% respectively. CSQ’s discount in June 2009 settled to a more modest 8%.
Even in a more modest and more common sell-off that we saw in the fall of 2018, CSQ’s NAV declined more than 8% for the year. Its stock price lost nearly 5%, roughly in line with the S&P 500, which declined over 4%. CSQ finished the year at a 9% discount to NAV. However, as the market roared back in 2019, with the S&P returning over 31%, CSQ’s NAV returned over 35%, while its stock price improved over 38%.
For 2018 and 2019 combined, the S&P returned 27%, in line with the NAV return of CSQ which offered the same. However, CSQ’s price return over that two-year period was nearly 34%. CSQ price returned to a premium over NAV later in October of 2019.
Back to today, CSQ was trading at a premium as recently as March 2. On Wednesday, the fund was at a 17.6% discount as its NAV had declined 35% since 2/19, roughly in line with the S&P 500, while its price was down over 47%.
In this context, if you have consternation about buying the S&P 500 after a 35% decline in one month as we have seen, would you be more willing if many of those stocks could be purchased at levels below that in a CEF, if they were offered at an additional 17% discount on top of that? Is that a more compelling entry point? Similar experiences occurred in other Calamos CEFs, as well as other funds.
The Role of Leverage
A fair argument may be made that a large part of the reason that funds sell off dramatically is centered on the leverage and how that bears on the ability of the fund to perform and meet its dividend. That is usually predicated on either rising borrowing costs or NAV depreciation. It is difficult to assess where this will ultimately play out as asset prices can fluctuate on a daily basis.
This is carefully monitored. We consistently assess each fund’s use of leverage, and actively manage that level in our portfolios. Our distribution history is published on our website at www.calamos.com/funds/closed-end/
Compelling Values
Ultimately, closed-end fund returns both on the downside and back on the upside demonstrate that, over time, these vehicles have a history of recovery, and often outperform their respective associated index and corresponding NAV. You can see examples of how the Calamos funds have recovered in both prices and NAVs during challenging periods on our website. www.calamos.com/funds/closedend/
These unusual dynamics may offer solid values and buying opportunities as these assets may be purchased at prices sometimes below the NAV of the underlying portfolios. CEFs should not be viewed as trading vehicles, they are meant more for a buy and hold strategy. However, buying opportunities do avail themselves during these times of volatility, and should be considered.
For clients considering selling at these levels, I would certainly consider the spread between what the market is offering relative to the underlying NAV. This should be considered especially if the entry point in the stock price relative to the NAV was much narrower and closer to the norm than what is seen today.
As of February 19, three of our funds were trading at premiums as high as 7%. None was trading at a discount of higher than 2.5%. As of March 19, they were trading at discounts between 12% and 20%. As was the case in 2008 and later in 2018, CEFs at these levels relative to their recent and historical trading relationships can offer compelling entry points over time, offer professionally managed vehicles that provide income to your clients’ portfolios through diverse investments and strategies. The argument can be made that many funds, certainly including the Calamos funds, currently offer compelling values both on a relative and absolute basis.
Closed-end Funds Have Enjoyed a Resurgence in Popularity
The CEF market is not a broad space. According the Closed-End Fund Association, it is comprised of 637 funds across a wide spectrum of asset and investment strategies, with roughly $255 billion in assets under management. That compares to thousands of open-end mutual funds with more than $20 trillion. Although there are legacy managers, new issuers are typically larger, seasoned asset managers that have wirehouse distribution relationships.
The recent revitalization of the CEF IPO market has been due to not only the popularity of product, but also to the willingness of issuers, like Calamos, to front any and all expenses associated with the offering, thereby assuring that the fund’s IPO price and NAV are the same on the day of listing. We believe the expense is warranted to improve the overall experience of the CEF IPO investor and optimizing the ability of the fund to better perform on both an initial and ongoing basis. This effectively “no-load” to the IPO buyer structure has revitalized the industry and encouraged the participation of new financial advisors and customers alike. For more, see Investor-Friendlier Closed-End Fund IPOs Broaden Advisor Interest.
This is why it’s important to educate our clients, many of whom may be new to the product, and perhaps not familiar with how the prices can react relative to their NAVs during periods of extreme market volatility.
Calamos and Closed-end Funds
Calamos manages seven closed-end funds, representing approximately $6.8 billion in assets. We have been managing these products since 2002, offering portfolios that include convertibles bonds preferred stock, high yield bonds, equities, sovereigns, credit, floating rate loans and investment grade bonds.
The greater the emphasis of any securities types or asset allocation in any given portfolio depends on the mandate of the particular fund. That said, flexibility to manage our portfolios is critical. Accordingly, they’re structured to enable us to utilize a host of investments, regardless of the emphasis. This has proven to be beneficial to our clients as different markets can offer different opportunities at different times. Our CEFs are designed to provide income, while offering the opportunity to participate in the capital appreciation of the underlying securities.
All Calamos closed-end funds have offered monthly distributions that we believe are both competitive and realistic based on our assessments of both current and expected market conditions, in the context of the fund‘s positioning. Senior portfolio team members, headed by our Founder, Chairman and Global CIO, John P. Calamos Sr., make monthly assessments regarding our distribution levels. We understand that maintaining consistent levels, when in the best interest of our clients and the management of the portfolio, is important in optimizing the performance of the stock price of the fund as well. We strive to maintain competitive distribution levels relative to other funds in our respective peer groups. We base these levels on both short and longer term market and portfolio expectations, as well as the fund‘s earnings potential towards that established level.
Closed-end Funds as a Source of Income
Closed-end funds can serve as valued investment vehicles, offering the opportunity for income as well as total return. Over the long-term, they have proven to be effective tools as they serve to enhance exposures to various investment strategies as a way to improve income opportunities. The product has been especially desirable as the search for income has become even more challenging as interest rates have continued to drop over the last several years.
The appeal of the closed-end fund is that it can be included in the overall asset allocation of a client’s portfolio to increase income over a broad array of investment strategies. Given that many CEFs take advantage of leverage and coupled with the fact that borrowing levels have been low and both bond and stock prices have generally recently been on a positive trajectory, the recent environment has been advantageous for CEF performance as the structure has allowed for outperformance relative to unlevered alternatives.
In addition, CEFs are not subject to the cash requirements that open-end funds or ETFs are, and they are not subject to redemptions. This is beneficial to portfolio managers who do not have to consider fund flows, both in and out, in their respective strategies. Unlike open-end funds, investors achieve liquidity through access to trading markets.
Before investing carefully consider the fund’s investment objectives, risks, charges and expenses. Please see the prospectus and summary prospectus containing this and other information which can be obtained by calling 1-800-582-6959. Read it carefully before investing.
Opinions are subject to change due to changes in the market, economic conditions or changes in the legal and/or regulatory environment and may not necessarily come to pass. This information is provided for informational purposes only and should not be considered tax, legal, or investment advice. References to specific securities, asset classes and financial markets are for illustrative purposes only and are not intended to be, and should not be interpreted as, recommendations.
Important Risk Information. An investment in the Fund(s) is subject to risks, and you could lose money on your investment in the Fund(s). There can be no assurance that the Fund(s) will achieve its investment objective. Your investment in the Fund(s) is not a deposit in a bank and is not insured or guaranteed by the Federal Deposit Insurance Corporation (FDIC) or any other government agency. The risks associated with an investment in the Fund(s) can increase during times of significant market volatility. The Fund(s) also has specific principal risks, which are described below. More detailed information regarding these risks can be found in the Fund's prospectus.
Investments by the Fund(s) in lower-rated securities involve substantial risk of loss and present greater risks than investments in higher-rated securities, including less liquidity and increased price sensitivity to changing interest rates and to a deteriorating economic environment.
Fixed income securities are subject to interest rate risk; as interest rates go up, the value of debt securities in the Fund's portfolio generally will decline.
Each fund has specific risks, which are outlined in the respective funds' prospectuses. The general risks involved in investing in a closed end fund include market volatility risk, dividend and income risk, and loss of investment risk. Please refer to each fund's prospectus, annual and semi-annual reports at www.calamos.com for complete information on the fund's performance, investments and risks.
S&P 500 Index is generally considered representative of the U.S. stock market.
The ICE BofA All U.S. Convertibles Index (VXA0) comprises approximately 700 issues of only convertible bonds and preferreds of all qualities. Source ICE Data Indices, LLC, used with permission. ICE permits use of the ICE BofA indices and related data on an ‘as is’ basis, makes no warranties regarding same, does not guarantee the suitability, quality, accuracy, timeliness, and/or completeness of the ICE BofA Indices or data included in, related to, or derived therefrom, assumes no liability in connection with the use of the foregoing and does not sponsor, endorse or recommend Calamos Advisors LLC or any of its products or services.
The MSCI World Index is a free float-adjusted market capitalization weighted index that is designed to measure the equity market performance of developed markets.
ICE BofA Global 300 Convertible Index is a global convertible index composed of companies representative of the market structure of countries in North America, Europe and the Asia/Pacific region. Source ICE Data Indices, LLC, used with permission. ICE permits use of the ICE BofA indices and related data on an ‘as is’ basis, makes no warranties regarding same, does not guarantee the suitability, quality, accuracy, timeliness, and/or completeness of the ICE BofA Indices or data included in, related to, or derived therefrom, assumes no liability in connection with the use of the foregoing and does not sponsor, endorse or recommend Calamos Advisors LLC or any of its products or services.
ICE BofA Merrill Lynch Global HY Constrained Index tracks the performance of below-investment grade corporate debt denominated in US dollars, Canadian dollars, pounds and euros that are publicly issued in the major US or Eurobond markets.
ICE BofA US High Yield Index tracks the performance of US dollar denominated below investment grade corporate debt publicly issued in the US domestic market.
NOT FDIC INSURED | NO BANK GUARANTEE | MAY LOSE VALUE
801950a 0320
Membership required
Membership is now required to use this feature. To learn more:
View Membership BenefitsSponsored Content
Upcoming Virtual Events View All


