The Math Is on Investors’ Side
Membership required
Membership is now required to use this feature. To learn more:
View Membership Benefits
Most baseball fans know that the New York Yankees is the winningest team in MLB history. Of the 18,426 games it’s played since 1901, it’s won 10,378, or about 57 percent of them.
The Yankees have also won the most World Series championships. Between 1903 and 2019, the team has lifted the Commissioner’s Trophy a record 27 times, a win rate of 23.5 percent. (The 1994 World Series was cancelled due to a strike.)
As impressive as this track record is, it doesn’t come close to the U.S. stock market’s.
Over the past 90 years, the S&P 500 Index has ended the year up 61 times, for a win rate of 68 percent, or a little more than two-thirds of the time.
This means, of course, that the market has statistically ended the year down one out of every three times. It’s even rarer for it to sink lower two or more years in a row. This happened in the periods 1929 – 1932, 1939 – 1941, 1973 – 1974 and 2000 – 2001.
The implication of all this is that it’s historically been a winning strategy to bet on high-quality U.S. stocks over the long term. As I shared with you last month, there have been only three major instances when the S&P 500 delivered negative returns for the 10-year period—the two most notable being the Great Depression and the Great Recession. Had you cashed out during any other period after holding your S&P stocks for 10 years or longer, you would have seen a profit.
Thursday’s Stock Correction Was a Non-Event, According to Math
You can probably guess where I’m going with this. Stocks had an incredibly volatile week, following the best 50-day rally in S&P history. On Thursday, the market sold off close to 6 percent, its worst one-day trading session since March 16. The only stock to end in the black was Kroger, essentially flat at 0.4 percent.
Some wonder if we’re in store for a new bear market.
Analysts at LPL Financial addressed this very topic this week. Stocks were extremely overbought, up an astounding 4.78 standard deviations for the 60-day rolling period over the past five years. This flashed a screaming sell signal, and according to the math, a substantial pullback was expected.
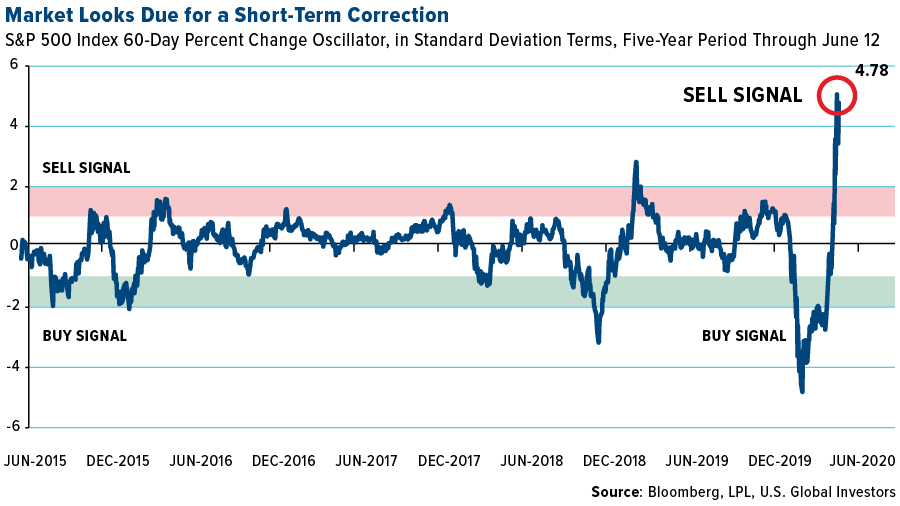
The rally that ended on Thursday was “one of the greatest surges off a major low ever,” according to LPL. And when this happened in the past, a drawdown was “perfectly normal.”
Between 1957 and now, in fact, the average drawdown after such a move was minus 10.3 percent. The median drawdown was minus 9.3 percent.
The correction, in other words, was expected. Mean reversion is a powerful indicator we regularly use to detect buy and sell signals.
Long-Term, Stocks Still Look Relatively Calm
Everything I just said applies only to the short term. Over the long term, it’s a different story.
Below is an oscillator chart similar to the one above, but instead of looking at the 60-day trading period over five years, it looks at the year-over-year percent change for the 20-year period.
As you can see, Thursday’s selloff didn’t even amount to a blip. The market was unchanged at 0.35 standard deviations. It was a non-event. So once again, a long-term investment horizon makes sense.

Fed Has Declared War on the COVID-19 Economy
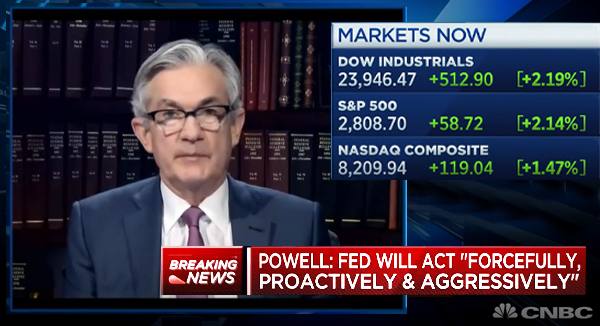
Another reason why I’m still bullish on stocks? The Federal Reserve has declared financial war on the COVID-19 economy. In the words of Jerome Powell, the Fed has “forcefully, proactively and aggressively” utilized every financial weapon at its disposal, from record-low interest rates to unprecedented money-printing.
Many, including myself, have been critical of some of these decisions, but the truth is that Powell & Co. have little other choice. A staggering 93 percent of the world’s economies are now in recession due to the virus, according to the World Bank’s flagship “Global Economics Prospects” report. That’s the largest such share of economies in recession in modern history, greater than the global financial crisis and Great Depression.

Granted, we’re much more globalized today than we were in the 1930s. When one country sneezes, the chances of everyone else catching it are far greater. The same globalization is what also helped the coronavirus spread so quickly and pervasively.
Extraordinary times such as these often call for extraordinary measures, but I don’t believe they’re such that investors should shy away from the market. History has shown that the math is on your side.
Gold Market
This week spot gold closed at $1,731.60, up $46.54 per ounce, or 2.76 percent. Gold stocks, as measured by the NYSE Arca Gold Miners Index, ended the week higher by 0.70 percent. The S&P/TSX Venture Index came in off 0.45 percent. The U.S. Trade-Weighted Dollar rose 0.20 percent.
|
Date |
Event |
Survey |
Actual |
Prior |
|---|---|---|---|---|
|
Jun-10 |
CPI YoY |
0.30% |
0.10% |
0.30% |
|
Jun-10 |
FOMC Rate Decision (Upper Bound) |
0.25% |
0.25% |
0.25% |
|
Jun-11 |
PPI Final Demand YoY |
-1.20% |
-0.80% |
-1.20% |
|
Jun-11 |
Initial Jobless Claims |
1550k |
1542k |
1897k |
|
Jun-14 |
China Retail Sales YoY |
-2.30% |
-- |
-7.50% |
|
Jun-16 |
Germany CPI YoY |
0.60% |
-- |
0.60% |
|
Jun-16 |
Germany ZEW Survey Expectations |
60 |
-- |
51 |
|
Jun-16 |
Germany ZEW Survey Current Situation |
-83 |
-- |
-93.5 |
|
Jun-17 |
Eurozone CPI Core YoY |
0.90% |
-- |
0.90% |
|
Jun-17 |
Housing Starts |
1100k |
-- |
891k |
|
Jun-18 |
Initial Jobless Claims |
1295k |
-- |
1542k |
Strengths
-
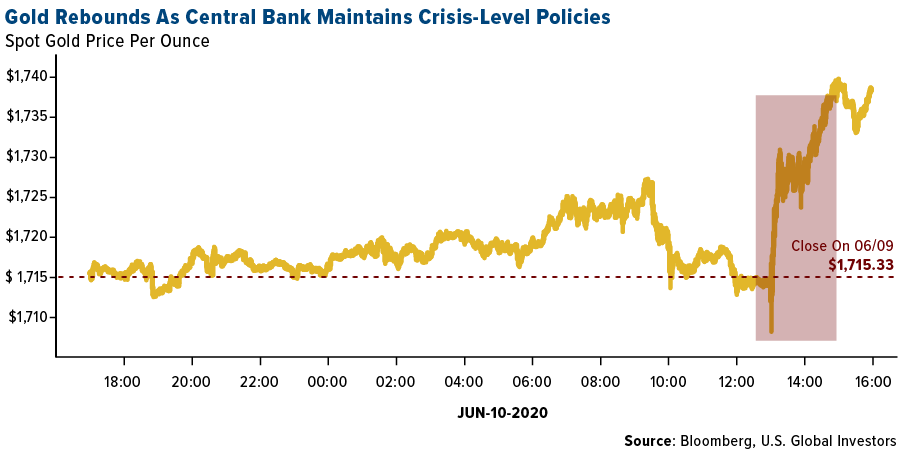
The best performing precious metal for the week was gold, up 2.78 percent. After its 1.7 percent drop last Friday, gold rose back above $1,700 an ounce this week as investors took advantage of buying the dip. Commerzbank AG analyst Carsten Fritsch told Bloomberg that gold price declines are still seen as a buying opportunity. “Central banks are not expected to reverse their policy of unchecked money-printing. Gold is likely to remain well-supported in this environment.”
-
Gold saw its biggest weekly gain since early April as the worsening economic outlook due to a rising number of COVID-19 infections boosted demand for the haven metal. Stocks had their worst day since March on Thursday, with the Dow plunging more than 1,800 points or almost 7 percent. The yellow metal often moves in the opposite direction of the wider stock market.
-
Gold futures rallied this week after the Fed announced it would keep interest rates lower for longer and reiterated its dovish view. Officials forecast keeping rates near zero through 2022, which is bullish for the yellow metal. Spot gold finished near $1,740 an ounce on Wednesday after the Fed meeting.
Weaknesses
-
The worst performing precious metal for the week was palladium, down 0.77 percent. Gold imports by India fell 99 percent in May, the second straight month of declines, due to COVID-19 restrictions. Bloomberg reports that shipments fell 1.3 tons last month from 105.8 tons a year earlier and follows a record low of just 60 kilograms imported in April.
-
The Perth Mint reported that its gold coin and bar sales totaled just 63,393 ounces in May, down from 120,504 in April. Silver sales were also lower – 997,171 ounces in May versus 2.12 million in April.
-
Due to extreme disruptions to the gold market earlier this year, banks have shifted some positions out of New York futures and into the London over-the-counter market, according to the London Bullion Market Association (LBMA). “The scale of the dislocation has really made everyone ask questions in terms of the ongoing approach of hedging long London, short Comex,” Ruth Crowell, LMBA CEO, said in a phone interview with Bloomberg. “Certainly in the short to medium future, it’s not an even hedge. So they’re having to either go OTC, or they’re reducing their trading appetite.”
Opportunities
-
Artemis Gold is buying the Blackwater Project, one of the largest open-pit gold deposits in Canada, from New Gold, reports Bloomberg. The project has a measured and indicated mineral resources of 9.5 million ounces. Zijin Mining Group is acquiring Guyana Goldfields for a significant premium over what Silvercorp Metals offered in late April.
-
Goldman Sach’s Jeff Currie says gold prices could rise beyond $2,000 an ounce if the Fed tolerates above-target inflation. “While this is not our base case, we see the tail risk of above-target inflation as a potential driver for gold prices beyond $2,000.” Roth Capital said precious metals and related equities could significantly outperform the market in 2020 and peak in 2022. Bloomberg reports that Roth sees gold rising to as much as $2,200 per ounce and silver to as much as $27.50. Analysts say that the Fed buying debt and inflating its balance sheet, coupled with the government printing money, bodes well for precious metals and their equities.
-
HSBC chief precious metals analyst James Steel said in a note this week that silver could see further gains in this year and next as coin and bar demand “may rise further as investors seek out hard assets.” Although the 2020 forecast was lowered, the bank forecasts a supply deficit of 154 million ounces amid virus disruptions to mining.
Threats
-
The five biggest diamond miners are stuck with inventories worth around $3.5 billion, according to Bloomberg. De Beers, the largest, sold just $35 million of stones in May, down from $416 in sales the same period a year ago. Societe Generale said diamond miners are facing “a double whammy of weak prices and a sharp decline in sales volumes on a scale reminiscent of the 2008-09 crisis.”
-
South Africa’s mining output fell the most since at least 1981 in April when almost all economic activity was brought to a halt to curb the spread of the coronavirus. Statistics South Africa reported that total production fell 47.3 percent from a year earlier, compared with just an 18 percent decrease in March.
-
COVID-19 infections are rising rapidly in several U.S. states after lockdown measures were eased or removed in May. This could spur another round of lockdowns and spell trouble for the industry, again. The gold market disruptions were largely driven by a lack of commercial flights and the closure of refineries. If another global lockdown is enacted, some miners could see the closures of projects just weeks after reopening.
|
|
|||||
|
|
June 11, 2020 |
|
June 8, 2020 |
|
June 4, 2020 |
|
|
|||||
Index Summary
-
The major market indices finished down this week. The Dow Jones Industrial Average lost 5.55 percent. The S&P 500 Stock Index fell 4.71 percent, while the Nasdaq Composite fell 2.30 percent. The Russell 2000 small capitalization index lost 7.93 percent this week.
-
The Hang Seng Composite lost 1.39 percent this week; while Taiwan was down 0.43 percent and the KOSPI fell 2.27 percent.
-
The 10-year Treasury bond yield fell 2 basis points to 0.709 percent.
Domestic Equity Market
Strengths
-
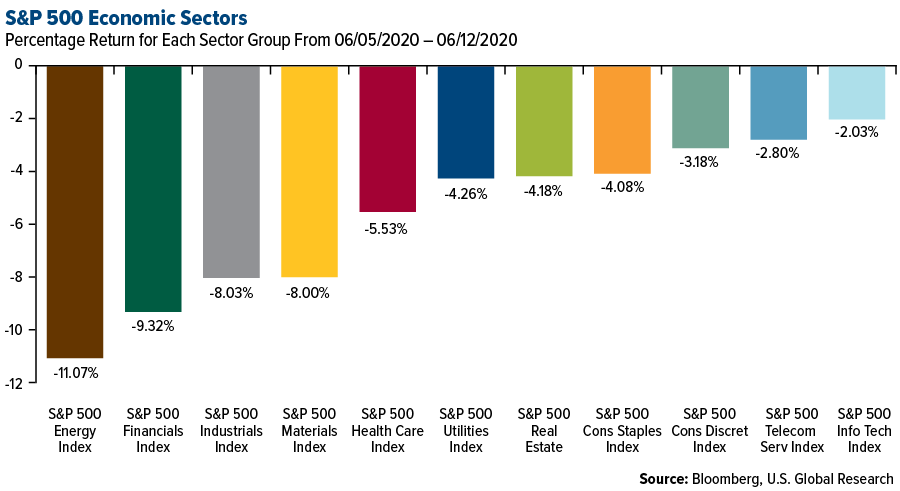
Information technology was the best performing sector of the week, decreasing by just 2.03 percent versus an overall decrease of 4.71 percent for the S&P 500.
-
Take-Two Interactive Software was the best performing S&P 500 stock for the week, increasing 3.95 percent.
-
Adobe Inc. shares rose on Friday, with the software company hitting an all-time high after it reported second-quarter results that beat expectations. Brokers highlighted outperformance in Adobe’s digital media business, and a number of firms raised their price targets.
Weaknesses
-
Energy was the worst performing sector for the week, decreasing by 11.07 percent versus an overall decrease of 4.71 percent for the S&P 500.
-
Oneok Inc was the worst performing S&P 500 stock for the week, falling 24.83 percent.
-
Domestic equities took a nosedive on Thursday as renewed economic concerns amid a possible second wave of the coronavirus rattled investors. The S&P 500 Index plunged 5.9 percent for the day, its worst drop since March 16. The benchmark is now down 7 percent for the year, after erasing its 2020 losses just four sessions ago.
Opportunities
-
The secretive data analytics firm Palantir is preparing to file an S-1 ahead of a potential September IPO, Business Insider has learned. The IPO prep, first reported by Bloomberg, has been long anticipated at the 17-year-old company whose earliest backers include Peter Thiel's Founders Fund and In-Q-Tel, the investment arm of the U.S. intelligence and defense communities.
-
Japan's Mitsubishi Electric Corp said on Thursday it would buy part of a plant in Japan from Sharp Corp to meet growing demand for power management chips used in electric vehicles.
-
Take-Two Interactive Software was upgraded to buy from neutral at MKM Partners on optimism that it would be releasing a remastered version of Grand Theft Auto V for Sony’s upcoming PlayStation 5.
Threats
-
Stocks have shrugged off slowing domestic growth and surging unemployment to post fresh highs in recent weeks, but wealth manager Peter Boockvar thinks a big fall of 10 percent could be on the way.
-
S&P Global Ratings questioned SoftBank Group Corp's financial discipline as the tech conglomerate pursues a massive 2.5 trillion yen ($24 billion) share buyback program in volatile markets.
-
Chinese companies are putting off plans for U.S. listings as tensions between the world's top two economies rise, reports Reuters.
The Economy and Bond Market
Strengths
-
Americans' view of the economy improved in early June as the country continued to reopen while trying to contain the coronavirus pandemic, according to a University of Michigan survey released Friday. The survey's index of consumer sentiment rose to 78.9 in the two weeks ended June 10, from 72.3 for the previous four weeks, writes the Wall Street Journal.
-
The National Federation of Independent Business says the Small Business Optimism Index increased 3.5 points in May. The trade association says owners are optimistic about future business conditions and expect the recession to be short-lived.
-
Mortgage applications rose by 9.3 percent from one week earlier on a seasonally-adjusted basis for the week ending June 5, according to the Mortgage Bankers Association’s Weekly Mortgage Applications Survey.
Weaknesses
-
Treasury Secretary Steven Mnuchin said the U.S. shouldn’t shut down the economy again even if there is another surge in coronavirus cases. “We’ve learned that if you shut down the economy, you’re going to create more damage -- medical problems that get put on hold,” Mnuchin said Thursday on CNBC. “We can’t shut down the economy again.”
-
The Federal Reserve put a spotlight on job losses and risks to the financial sector in its semi-annual report to Congress released Friday, writes BondBuyer.com. “Despite increased resilience from the financial and regulatory reforms adopted since 2008, financial system vulnerabilities—most notably those associated with liquidity and maturity transformation in the nonbank financial sector—have amplified some of the economic effects of the pandemic,” officials said.
-
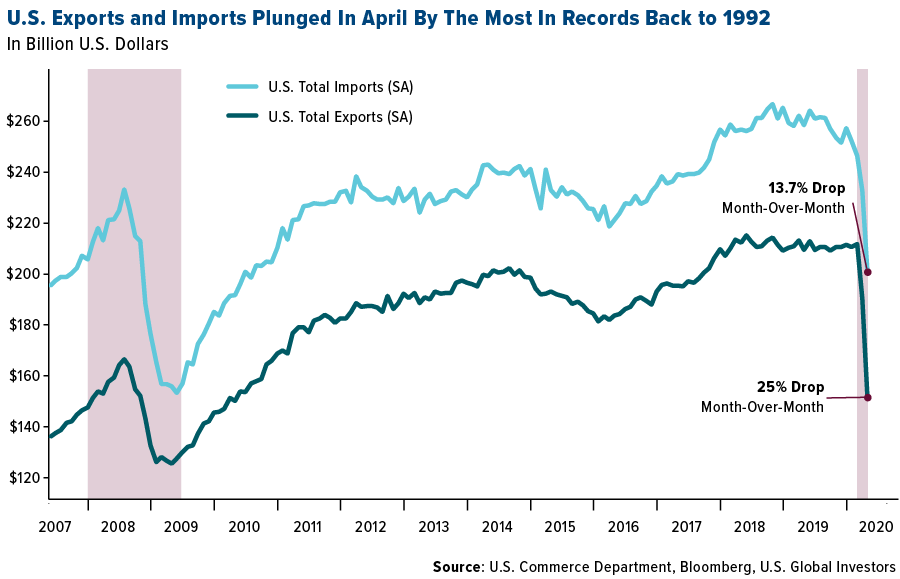
U.S. trade in goods and services fell in April to the lowest level in nearly a decade as the coronavirus pandemic stifled demand and hindered logistics. Exports plunged 20.5 percent from the prior month to $151.3 billion, while imports decreased 13.7 percent to $200.7 billion. Combined, the value of U.S. exports and imports declined to $352 billion, the lowest since May 2010, Commerce Department data showed.
Opportunities
-
One of the key data releases next week will be Tuesday’s retail sales. After a record 16.4 percent month-on-month drop in April, retail sales in America are forecast to have rebounded by 7 percent in May.
-
Industrial production is also expected to have begun recovering, with a projection for a 2.4 percent month-over-month improvement. Other indicators are expected to point to an uptick in economic activity as well. Building permits and housing starts due on Wednesday are forecast to have risen in May, while the Empire State and Philly Fed manufacturing gauges, out on Monday and Thursday respectively, will probably show the sector is contracting at a slower pace in June.
-
After a resurgence in U.S. coronavirus cases, the dollar could again find itself being a magnet for safe-haven flows, ending its downside correction.
Threats
-
The COVID-19 pandemic has triggered the "most severe recession in nearly a century," the Organization for Economic Co-operation and Development warned on Wednesday as it released two scenarios for how the virus could develop and impact global markets. The OECD said: "With little prospect of a vaccine becoming widely available this year, and faced with unprecedented uncertainty, the OECD has taken the unusual step of presenting two equally likely scenarios - one in which the virus is brought under control, and one in which a second global outbreak hits before the end of 2020."
-
Moody’s says this year’s hurricane season poses increased risks for state and local governments along the Atlantic and Gulf coasts that are still struggling to recover from the pandemic. “The disruption, property damage, and costs of recovery from a natural disaster event in the coming months would compound governments’ coronavirus health and fiscal challenges,” Pisei Chea, an analyst at Moody’s, wrote in a report co-authored by five other analysts published Tuesday.
-
In just two months California lost more jobs than it did through the Great Recession and now faces a $54 billion shortfall through fiscal 2021 — more than three times its record savings account.
Energy and Natural Resources Market
Strengths
-
The best performing commodity for the week was iron, up 2.76 percent. Iron ore surged above $100 a ton on Monday after Brazil ordered Vale SA to suspend operations that account for 10 percent of its output after workers tested positive for COVID-19, reports Bloomberg. This has boosted concerns of a supply shock that other operations in the country could be halted. Morgan Stanley said prices could hold above $100 for the next two months, but that lower prices are expected in the fourth quarter. Citigroup said that iron could “easily spike” to $120 a ton amid the shutdowns.
-
After a turbulent week, copper ended on a positive note. Stockpiles of the red metal in China fell to the lowest level this year, while orders to pull holdings from the LME rose, reports Bloomberg. The Shanghai Futures Exchange announced that inventories of copper held at warehouses in China fell 8.4 percent to 128,131 tons – the lowest level for this time of year in six years. The metal finished the week up 2.55 percent.
-
According to data released by the Energy Information Administration (EIA), energy-related carbon dioxide emissions in the U.S. will fall 14 percent this year due to lockdown orders that closed factories and left cars and jets parked. The agency forecast a drop of 7.5 percent in April when the coronavirus lockdowns began. Although negative for electricity and fuel consumption, this is positive for the goal of reducing CO2 emissions, even if unintentional.
Weaknesses
-
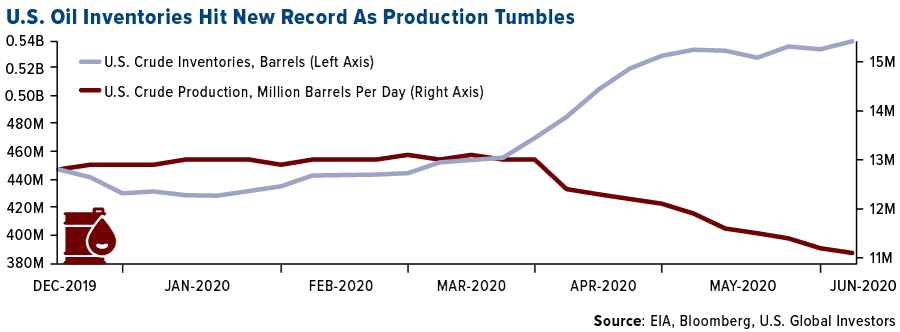
The worst performing commodity for the week was crude oil, down 7.89 percent for its first weekly loss since late April. Despite a massive drop in crude production, crude inventories are still rising. OPEC+ agreed to record output curbs by an extra month, but Saudi Arabia signaled that it will not prolong the cuts after June. The market is also flooded with diesel. According to the EIA, diesel supplied fell to just 2.72 million barrels a day last week, the lowest weekly level in 21 years, while stockpiles have grown for nine straight weeks.
-
BP’s CEO said in an internal note this week that the company plans to let go 14 percent of its workforce, or 10,000 jobs. The cuts will mostly affect in-office staff and those with senior roles. The move is an acceleration to slim down for the transition to cleaner energy amid the deep slump in oil prices. Chesapeake Energy Corp is reportedly preparing a potential bankruptcy filing – a signal of deep peril in the American shale industry.
-
The chief investigating committee of the Norilsk Nickel diesel spill last week said it has detained the chief engineer and director of the power plant. The committee said it found that the destroyed fuel tank that caused the accident had needed an overhaul since 2018, but the tank continued to be in operation despite the violation of safety rules. Norilsk said it has pledged $146 million to cleaning up the massive arctic fuel spill.
Opportunities
-
Jeffries analysts wrote in a note on Tuesday that copper miners including Freeport-McMoRan and First Quantum Minerals could outperform the broader market. Copper inventories trending lower point to growing demand for the metal. The analysts said “many of the fast-moving signals that copper tends to key off are screaming higher” and if the miners “begin to outperform the broader market, there is lots of running room to the upside for that trend to continue.”
-
Germany announced that it is partnering with Morocco to build the first green hydrogen industrial plant in Africa. The Minister for Economic Cooperation and Development said: “Countries in North Africa in particular are suitable production locations because the sun shines almost indefinitely here.” Germany’s cabinet passed a national hydrogen strategy to help decarbonize its industry.
-
Tepco Renewable Power, a unit of Japan’s biggest utility Tokyo Electric Power Co. Holdings, plans to spend more than $18 billion over the next decade to increase its green power generation by as much as 70 percent. Bloomberg reports that offshore wind and hydro generation are the unit’s main focuses. Adani Green Energy said it will invest nearly $6 billion to build 8 gigawatts of solar generation projects. The Indian company has a goal of becoming the world’s biggest renewable power company by 2025.
Threats
-
The five biggest diamond miners are stuck with inventories worth around $3.5 billion, according to Bloomberg. De Beers, the largest, sold just $35 million of stones in May, down from $416 in sales the same period a year ago. Societe Generale said diamond miners are facing “a double whammy of weak prices and a sharp decline in sales volumes on a scale reminiscent of the 2008-09 crisis.”
-
According to BloombergNEF research, installations of renewable power capacity is set to fall 31 percent in the 2020s compared with the previous decade. Total spend on new renewable sources such as wind and solar will hit $1 trillion by 2030, but is minor in comparison to the $2.7 trillion spent in the 2010s. BNEF CEO Jon Moore said: “The last decade produced huge progress, but official targets for 2030 are far short of what is required to address climate change.”
-
Weeks after economies globally began lifting restrictions intended to stem the spread of COVID-19, the number of new infections are rising, especially in the U.S. 30 states have accelerating growth of new infections, the highest since May 20. In Latin America, Brazil has the highest 3-day growth of cases at 10 percent. Global equities tumbled on Thursday as investors took notice of the potential second wave of infections.
Emerging Europe
Strengths
-
Turkey was the best relative performing country this week, losing 20 basis points. All Eastern and Central European markets traded lower. This week investors become more cautious about risky assets as some parts of the world recorded an increase in the number of coronavirus cases. Turkey outperformed its peers supported by stronger performance by material and goods producers. Akcansa Cimento A.S., a cement producer, was the best performing equity trading on the Istanbul Stock Exchange. The company gained 25 percent over the past five days supported by optimism over reopening shopping malls.
-
The Romanian leu was the best relative performing currency this week, losing only 26 basis points. All currencies of Eastern/Central Europe traded lower, but the leu outperformed its peers. Pension funds asked the European Central Bank (ECB) to consider including non-euro area states like Romania, Bulgaria and Croatia in its Pandemic Emergency Purchase Programme to support growth across the EU.
-
Consumer staples was the best performing sector among eastern European markets this week.
Weaknesses
-
The Czech Republic was the worst performing country this week, losing 2.8 percent. The Czech government approved a plan to widen the 2020 budget deficit for the third time, as the impact of the coronavirus crisis is likely to be stronger than initially expected. Austrian Bank listed on the Prague exchange was the worst performing equity, losing 7.2 percent over the past five days.
-
The Russian ruble was the worst performing currency in the region this week, losing 1.5 percent. The ruble weakened with the price of oil. Last weekend OPEC and non-OPEC members agreed to extend production cuts by another month, but the agreement did not stop the oil price from falling, as some investors are concerned with a second wave of COVID-19 infections coming. Brent crude oil closed at $38.86 per barrel, down from $42.30 last Friday.
-
Financials was the worst performing sector among eastern European markets this week.
Opportunities
-
Eurozone investor confidence jumped to negative 24.8 in June from negative 41.8 in May, pointing to a slow recovery as more businesses are opening. The Sentix Investor Confidence Index rates the relative six-month economic outlook for the euro zone. The data is compiled from a survey of about 2,800 investors and analysts. A reading above zero indicates optimism; below indicates pessimism. The June reading is still well below the zero level.
-
Poland’s most dovish central banker says the time has come to include stocks in the billions of dollars of asset purchases. Poland has one of the developing world’s biggest bond-buying programs, already purchasing 84.4 billion zloty bonds ($21.3 billion). Eryk Lon said that it is time to explore options to follow the Bank of Japan into buying equities.
-
Polish utilities outperformed this week and may continue to move higher as the government could allow utilities to spinoff unprofitable coal production business. Any deeper overhaul of the coal mining industry probably will not happen before the country’s presidential elections planned for June 28.
Threats
-
Tourists are slowly planning to return to the most popular travel spots in Europe, but the recovery will not be quick, as people remain cautious about travel. The most negatively exposed country due to a slow travel season this summer is Greece; the country has the greatest rate of people employed in the service industry. According to Bloomberg, almost half of the 600,000 employees in tourism and food businesses will lose their jobs this year.

-
The mishandling of the biggest oil spill in Russia could lead to the country’s new environmental regulations. MMC Norilsk Nickel PJSC, Russia’s biggest miner, did not make a public statement about the oil spill until two days after the May 29 accident, which leaked over 20,000 tons (150,000 barrels) of diesel into the Arctic river system. The preliminary clean-up cost is estimated at $145 million. This accident may lead to longer-term consequences not only for Norilsk but other Russia producers as well who have their operating sites sitting on melting permafrost.
-
Romania, for now, avoided a credit rating downgrade to junk, with S&P Global Rating affirming Romania’s credit rating at the lowest investment grade with a negative outlook. S&P believes that the country’s current account deficit will widen, reaching about 5 percent of GDP in 2020. In addition, the downgrade may be unavoidable if the government will not be able to fix fiscal and external balances.
China Region
Strengths
-
Pakistan was the best performing country this week, gaining 91 basis points. The government is planning to lower the fiscal deficit to 7 percent of gross domestic product from 9.2 percent. The nation’s central bank cut interest rates by a cumulative 525 basis points this year to support the economy. Azgard Nine LTD, a textile producer and distributor, was the best performing equity among stocks trading on the Karachi Stock Exchange, gaining 28 percent over the past five days.
-
The Thailand baht was the best performing currency this week, gaining 1.7 percent. The currency strengthened the most among peers on a dovish Federal Reserve, breaching its 200-day moving average resistance, a technical pattern that could encourage inflows.
-
Materials was the best performing sector among equites trading on the Hong Kong Stock Exchange.
Weaknesses
-
Thailand was the worst performing market this week, losing 3.7 percent. Thailand still remains under a state of emergency, and most international flights are banned through June. With sealed borders and restrictions on travel, tourism will be slow to rebound, and tourism is one of the most important sources of revenue for the country. Indorama Ventures was the worst performing equities among those trading in the MSCI Thailand ETF (THD), losing 14 percent over the past five days.
-
The Indonesia rupiah was the worst performing currency this week, losing 1.6 percent. Most Asian currencies extended their retreat, led by the rupiah, as investors’ focus shifted to a potential deep slowdown in the global economy amid a resurgence of U.S. coronavirus cases.
-
Energy was the worst performing sector among equites trading on the Hong Kong Stock Exchange.
Opportunites
-
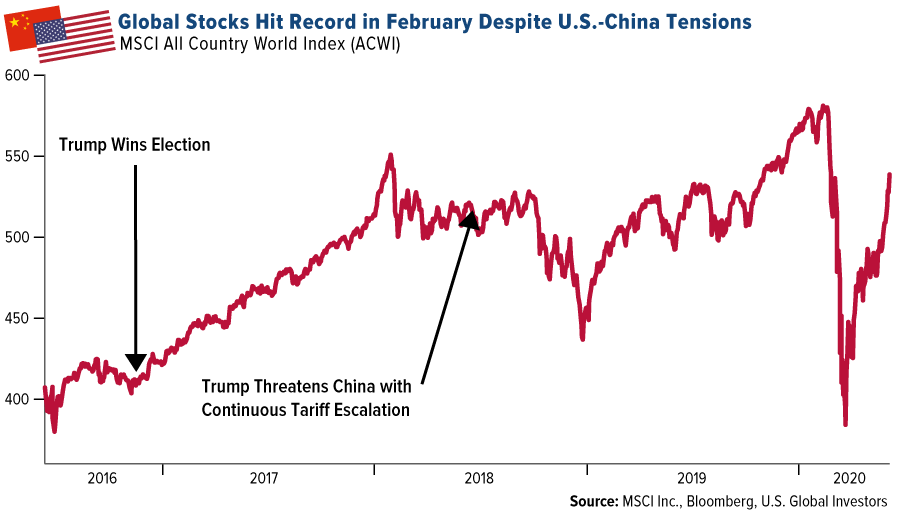
Ajay Kapur, head of Asia and global emerging-market strategy at Bank of America, says that the U.S.-China rivalry could have many benefits, particularly in driving investment and innovation. The escalation in tensions between the two countries since President Trump took office in 2017 has been viewed as negative by stock traders, but in fact could be positive. As seen in the chart below, global stocks hit a record in February despite increased tensions between the U.S. and China at the time. “For equity investors, especially growth investors, the seeds of new military-civilian technologies that are germinating today will be irrigated by the full-blown great power rivalry, and blossom in unknown ways in the coming decades,” Kapur wrote with colleagues Ritesh Samadhiya and Aritra Baksi.
-
Contemporary Amperex Technology Co. Ltd., a Chinese company that makes electric car batteries for Tesla and Volkswagen, has developed a power pack that lasts more than a million miles, reports Bloomberg. The company said it is ready to produce the battery that lasts 16 years, or 1.24 million miles. Warranties on batteries currently used in electric cars cover on average 150,000 miles, or eight years, making this development a landmark for the industry. Chairman Zeng Yuqun said that the battery would cost around 10 percent more than current electric vehicle batteries.
-
JPMorgan notes that credit growth in China continued in May. M2 growth was 11.1 percent and bank loan growth rose to 13.2 percent for the month. “Details in new loans show continuous solid growth in medium-term household loans in May, likely reflecting a near-term recovery in property transactions,” analysts including Grace Ng wrote in a weekly note.
Threats
-
Thailand’s benchmark SET Index now trades at 19.4 times analysts’ one-year earnings estimates – making it the most expensive stock market in Asia. Bloomberg notes this level is a record high amid the country’s strong rebound from the coronavirus selloff. However, Thailand’s recession recovery will likely take longer than other countries in the region as its main growth drivers of tourism and exports are unlikely to return to normal levels soon.
-
The Financial Times reported that China is facing a public outcry over its claim that Beijing had overcome poverty after Premier Li Keqiang said that more than two-fifths of the nation’s population makes less than $140 a month. “Given the current price level, the premier is suggesting 600m Chinese people are having trouble maintaining a basic living standard,” said an unnamed Beijing-based policy adviser.
-
New legislation from the U.S. shows that lawmakers are considering investing tens of billions in America’s semiconductor industry to help it retain an edge over China. Prior legislation has focused on chip research, but this latest bull emphasizes domestic manufacturing. Although positive for the U.S., this is negative for China in potentially losing business in its semiconductor sales and heating up tensions between the two countries.
Blockchain and Digital Currencies
Strengths
-
Of the cryptocurrencies tracked by CoinMarketCap, the best performing for the week ended June 12 was MorCrypto Coin, up over 674.15 percent.
-
Banning cash transactions and requiring identity verification has not noticeably hurt bitcoin’s oldest operating peer-to-peer exchange, market data shows and CoinDesk reports. LocalBitcoins made significant changes to its policies in June of last year, and rather than stifling its business, volume on the exchange has ebbed and flowed with leading centralized exchanges, which is great news.
-
According to a survey from Fidelity Investments, about a third of large institutional investors own digital assets such as bitcoin, reports Bloomberg. The firm surveyed nearly 800 institutions in the U.S. and Europe, and 36 percent of respondents said they own cryptocurrencies or derivatives.
Weaknesses
-
Of the cryptocurrencies tracked by CoinMarketCap, the worst performing for the week ended June 12 was GAPS, down 69.39 percent.
-
After physically taking over the Beijing Bitmain office, ousted CEO Micree Zhan is reportedly regaining control, reports CoinTelegraph. In addition, Zhan is blocking the delivery of Bitmain products from its Shenzhen factory. Although the reason for doing so still remains unclear, sources of Chinese publication BlockBeats says that Zhan issued an order prohibiting employees from shipping products to Bitmain’s customers.
-
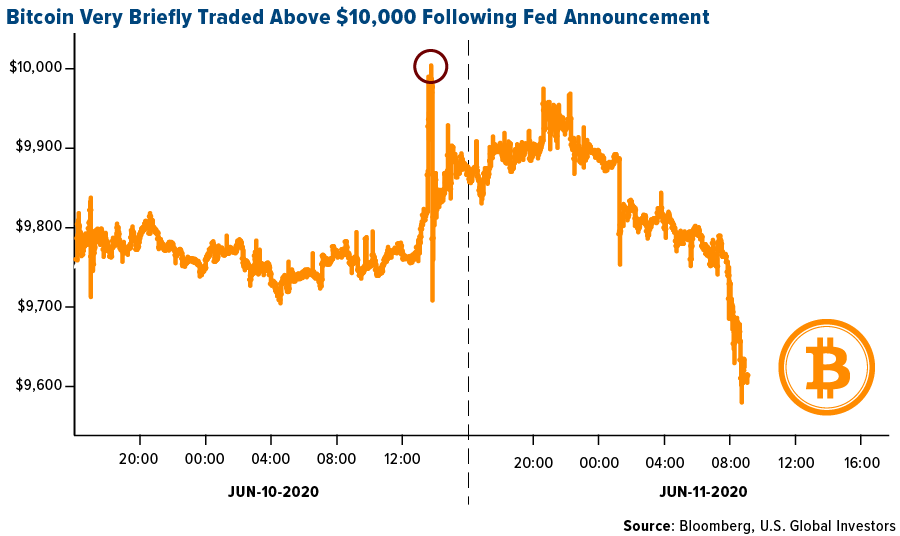
Bitcoin very briefly traded above $10,000 this week following the Federal Reserve’s announcement that it would keep interest rates lower for longer, but just as quickly fell back to its 20-day trading range. The world’s largest digital coin by market cap is still 50 percent below its high of $19,511 reached on December 18, 2017.
Opportunities
-
There might be a stock for investors looking to bet on the coming adoption of digital assets, writes CoinDesk. Voyager Digital is a New York-based broker that aims to help individual investors buy and trade cryptocurrencies. Shares of Voyager Digital are outperforming this year, the article continues, with triple the year-to-date returns of bitcoin.
-
Coinbase, the largest cryptocurrency exchange in the U.S., is considering offering support for a variety of new digital assets, reports CoinDesk, including Vechain, Synthetix and DigiByte. “We will add new assets on a jurisdiction-by-jurisdiction basis, subject to applicable review and authorizations,” an announcement from Coinbase reads. “Our customers can expect Coinbase to make future, similar announcements as we continue to explore the addition of numerous assets across the platform.”
-
Crypto exchange Binance Holdings is adding quarterly bitcoin futures to its suite of derivatives products, reports Bloomberg. According Binance CEO Zhao “CZ” Changpeng, the contracts will be settled in bitcoin and expire on the last Friday of the quarter. The new product is available on the company’s web trading platform and will be accessible on its mobile version at a later date.
Threats
-
In one 24-hour period this week, a mystery Ethereum trader paid a combined $5.2 million in transaction fees to move only $86,130. According to several sources, the user paid $2.6 million in fees to send $86,000 of Ethereum in one transaction, and another $2.6 million to send only $130. There’s much speculation why this happened, ranging from money laundering to human error to a malfunctioning trading bot. Whatever the case, the incident underscores the reality that mistakes, even huge ones such as this, are still possible on blockchains.
-
Cryptocurrency-related Ponzi schemes have emerged so frequently in China that a court in Shenzhen has issued a warning to citizens to be more vigilant of such scams, Asia Crypto Today reports. Four people were sentenced by the court on Tuesday for their involvement in a crypto pyramid scheme that bilked victims of thousands of yuan. In December 2019, a similar scam duped Chinese investors out of $500 million, leading to the arrest of 72 people.
-
China isn’t the only region that’s having problems with crypto-related scam artists. European law enforcement agency Europol busted a sophisticated yet illegal streaming service this week that had collected as much as 15 million euros ($17 million) in payments through a number of methods, including cryptocurrency. The incident will do little to dissuade critics that digital, anonymous crypto transactions can facilitate illegal behavior.
© U.S. Global
Membership required
Membership is now required to use this feature. To learn more:
View Membership BenefitsSponsored Content
Upcoming Virtual Events View All


