Chief Economist Scott Brown discusses the latest market data.
The economic calendar was thin. Investors remained concerned about rising cases of COVID-19. A return to a full lockdown appears unlikely, but the pace of improvement in the economy is expected to slow.
The ISM Non-Manufacturing Index rose to 57.1 in June, vs. 41.8 in April and 45.4 in May (a figure above 50 indicates expansion). The report showed business activity and new orders rebounding sharply, but employment continued to decline (less than in the two previous months). Jobless claims fell to 1.314 million, a larger-than-expected decline. However, claims figures are often quirky around major holidays and the level remains elevated. The Producer Price Index (PPI) fell 0.2% in June, largely reflecting a drop in food prices (following a surge in May). Ex-food, energy and trade services, the PPI rose 0.3% (-0.1% y/y).
Next week, the mid-month economic data reports are expected to reflect further improvement in the economy, but investors are likely to keep a close eye on the escalation in COVID-19 cases. Treasury will report another whopping budget deficit. Higher gasoline prices should add to the headline Consumer Price Index figure in June, but core inflation is expected to remain mild. Industrial production should pick up, reflecting a broad-based rebound in factory activity. Jobless claims will remain subject to seasonal distortions (the Independence Day holiday, the end of the school year), but the trend should remain lower (although still uncomfortably high). Retail sales are expected to have risen further, partly reflecting pent-up demand from the lockdown period. Residential construction figures are likely to be mixed (watch single-family permits).
Indices
| |
Last |
Last Week |
YTD return % |
| DJIA |
25706.09 |
25734.97 |
-9.92% |
| NASDAQ |
10547.75 |
10154.63 |
17.56% |
| S&P 500 |
3152.05 |
3115.86 |
-2.44% |
| MSCI EAFE |
1805.62 |
1783.59 |
-11.36% |
| Russell 2000 |
1398.92 |
1427.31 |
-16.16% |
Consumer Money Rates
| |
Last |
1 year ago |
| Prime Rate |
3.25 |
5.50 |
| Fed Funds |
0.00 |
2.38 |
| 30-year mortgage |
2.91 |
3.88 |
Currencies
| |
Last |
1 year ago |
| Dollars per British Pound |
1.2606 |
1.250 |
| Dollars per Euro |
1.1285 |
1.125 |
| Japanese Yen per Dollar |
107.20 |
108.46 |
| Canadian Dollars per Dollar |
1.359 |
1.308 |
| Mexican Peso per Dollar |
22.621 |
19.139 |
Commodities
| |
Last |
1 year ago |
| Crude Oil |
39.62 |
60.43 |
| Gold |
1803.80 |
1412.50 |
Bond Rates
| |
Last |
1 month ago |
| 2-year treasury |
0.14 |
0.20 |
| 10-year treasury |
0.57 |
0.74 |
| 10-year municipal (TEY) |
1.28 |
1.30 |
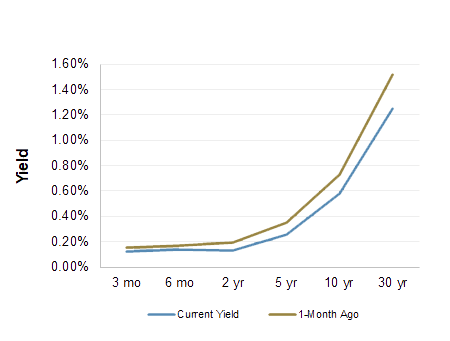
Treasury Yield Curve – 07/10/2020

As of close of business 07/09/2020
S&P Sector Performance (YTD) – 07/10/2020
Economic Calendar
| July 13 |
— |
Treasury Budget (June) |
| July 14 |
— |
Consumer Price Index (June) |
| July 15 |
— |
Tax Day |
| |
— |
Import Prices (June) |
| |
— |
Industrial Production (June) |
| |
— |
Fed Beige Book |
| July 16 |
— |
Jobless Claims (week ending July 11) |
| |
— |
Retail Sales (June) |
| |
— |
Homebuilder Sentiment (June) |
| July 17 |
— |
Building Permits, Housing Starts (June) |
| |
— |
UM Consumer Sentiment (mid-July) |
| July 22 |
— |
Existing Home Sales (June) |
| July 24 |
— |
New Home Sales (June) |
| July 29 |
— |
FOMC Policy Decision |
| July 30 |
— |
Real GDP (2Q20, adv. est., benchmark revisions) |
| July 30 |
— |
Employment Report (July) |
All expressions of opinion reflect the judgment of the Research Department of Raymond James & Associates, Inc. and are subject to change. There is no assurance any of the forecasts mentioned will occur or that any trends mentioned will continue in the future. Investing involves risks including the possible loss of capital. Past performance is not a guarantee of future results. International investing is subject to additional risks such as currency fluctuations, different financial accounting standards by country, and possible political and economic risks, which may be greater in emerging markets. While interest on municipal bonds is generally exempt from federal income tax, it may be subject to the federal alternative minimum tax, and state or local taxes. In addition, certain municipal bonds (such as Build America Bonds) are issued without a federal tax exemption, which subjects the related interest income to federal income tax. Municipal bonds may be subject to capital gains taxes if sold or redeemed at a profit. Taxable Equivalent Yield (TEY) assumes a 35% tax rate.
The Dow Jones Industrial Average is an unmanaged index of 30 widely held stocks. The NASDAQ Composite Index is an unmanaged index of all common stocks listed on the NASDAQ National Stock Market. The S&P 500 is an unmanaged index of 500 widely held stocks. The MSCI EAFE (Europe, Australia, Far East) index is an unmanaged index that is generally considered representative of the international stock market. The Russell 2000 index is an unmanaged index of small cap securities which generally involve greater risks. An investment cannot be made directly in these indexes. The performance noted does not include fees or charges, which would reduce an investor's returns. U.S. government bonds and treasury bills are guaranteed by the US government and, if held to maturity, offer a fixed rate of return and guaranteed principal value. U.S. government bonds are issued and guaranteed as to the timely payment of principal and interest by the federal government. Treasury bills are certificates reflecting short-term (less than one year) obligations of the U.S. government.
Commodities trading is generally considered speculative because of the significant potential for investment loss. Markets for commodities are likely to be volatile and there may be sharp price fluctuations even during periods when prices overall are rising. Specific sector investing can be subject to different and greater risks than more diversified investments. Gross Domestic Product (GDP) is the annual total market value of all final goods and services produced domestically by the U.S. The federal funds rate (“Fed Funds”) is the interest rate at which banks and credit unions lend reserve balances to other depository institutions overnight. The prime rate is the underlying index for most credit cards, home equity loans and lines of credit, auto loans, and personal loans. Material prepared by Raymond James for use by financial advisors. Data source: Bloomberg, as of close of business July 9, 2020.
© Raymond James
© Raymond James
Read more commentaries by Raymond James