2020 Midyear Outlook – Dog Years of Investing
Membership required
Membership is now required to use this feature. To learn more:
View Membership BenefitsMarkets thus far in 2020 have been, to use an overused word, unprecedented. In a matter of months, we have witnessed economic and market moves that typically take an entire market cycle of many years to unfold. So, we truly do see 2020 as a year when investors are gaining “dog years” of experience.
From a backdrop of broadly aligned global growth, which culminated in market highs around February 20, we have seen a global shut down of economic activity in response to the COVID-19 pandemic. With that “man-made recession”, we saw uncertainty and volatility spiking into the market lows of March 23. Those lows ultimately coincided with the Federal Reserve (Fed) announcing a commitment to support the U.S. markets, in concert with monetary and fiscal policy actions around the world.
In our piece Epidemiology of the Markets, published on March 22, we framed the economic and market prospects as largely being driven by the COVID-19 pandemic, which continues to evolve in ways market participants and health care professionals alike have not anticipated. As we approach mid-July, the U.S. continues to set records for new cases, and discussions have pivoted from concerns about a second wave to describing the ongoing first wave as a “forest fire.”
Enthusiasm about the economy possibly regaining momentum has been muted by ongoing uncertainty regarding the public health risks of reopening. While volatility has retreated sharply from the record highs of late March (see Exhibit 1), it remains at elevated levels. Recent moves have shown that markets are likely to respond to changes in new COVID-19 cases, both positively and negatively.
EXHIBIT 1: RECORD-HIGH VOLATILITY HAS ABATED, BUT REMAINS ELEVATED
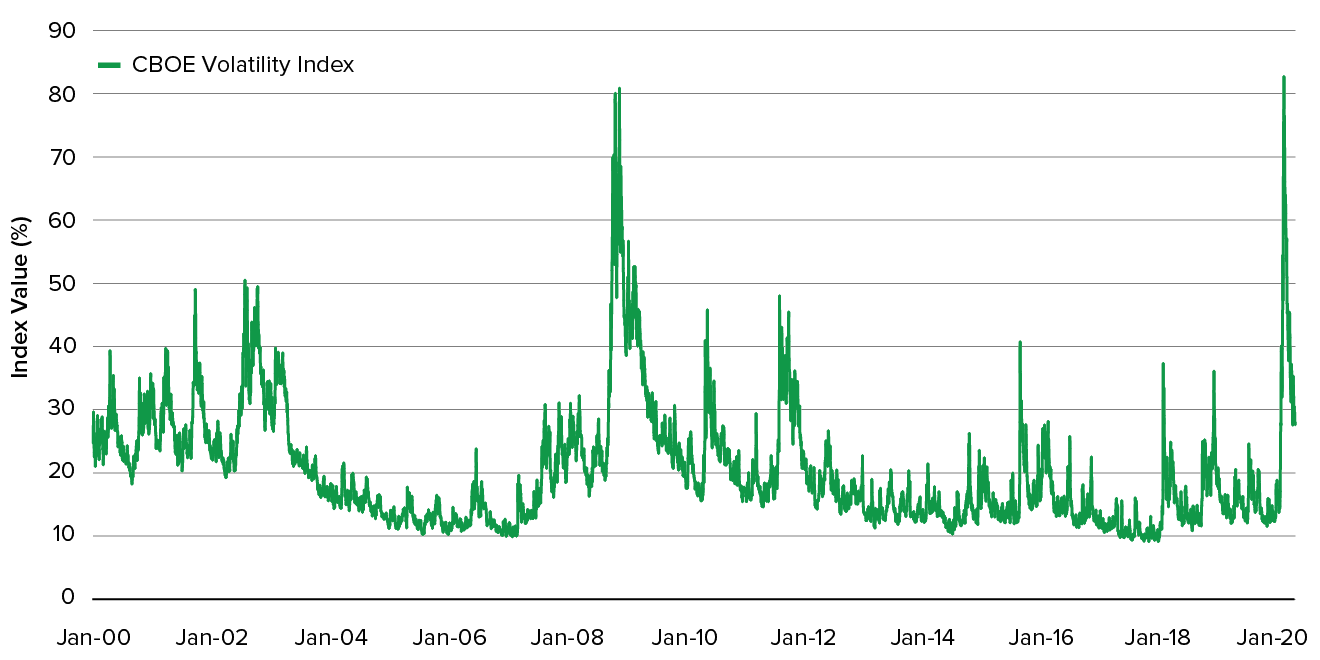
Source: Chicago Board Options Exchange (CBOE) Volatility Index. Data shows the historical measurement of expected market volatility based on the expected level of price fluctuation in the S&P 500 Index options from 2000 – July 10, 2020. The higher the value, the more the expected volatility. Past performance is not a guarantee of future results.
The S&P 500 Index fell by nearly 35% before making a low on March 23, almost exactly matching the fall during a typical recession. We believe this decline was indicative of the market pricing in a serious recession caused by the lockdown. In those prior cycles, the market took two to four years to recover whereas in this cycle we have seen a near full recovery in a matter of months, despite significantly depressed economic activity.
EXHIBIT 2: S&P 500 INDEX DRAWDOWNS DURING RECESSIONS
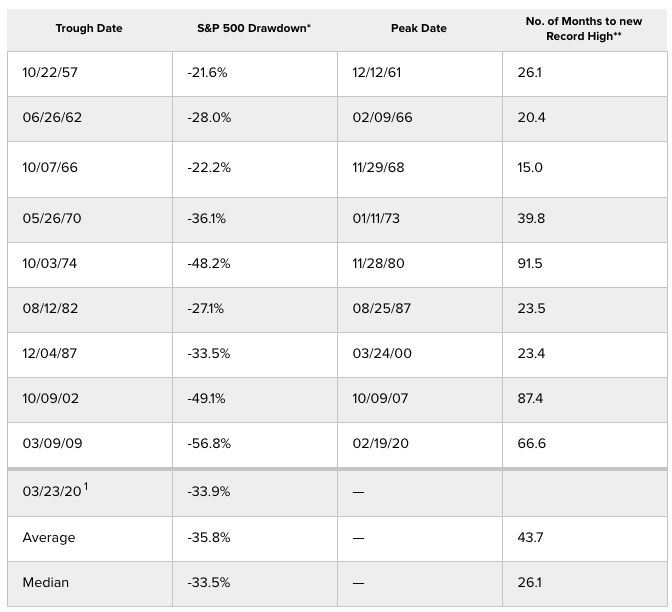
*Price return — does not include dividends. **Number of months assumes 30 days per month. ¹As of 03/23/2020. Source: Standard & Poor’s Corporation, Haver Analytics, Morningstar, Ivy Investments.
Since the March 23 trough, the S&P 500 Index has stabilized and advanced 43% as of July 10. Given this rapid bounce back, investors might wonder if the market is ahead of itself. We think it is important to acknowledge that the market is not a singular asset class. Rather it represents a universe of investment options comprised of a wide range of market capitalizations (small, mid and large cap) investment styles (growth, value and core), as well as asset classes (equities, fixed income and commodities.)
So far in 2020, we have seen wide dispersions in the performance among styles, size and asset classes. (See Exhibits 3 and 12.)
In times of uncertainty, investors want to pay a higher price for safety. Maybe the most extreme example would be in the U.S. Treasury market, where a 30-year bond has less than a 1.4% yield at the time of this writing. The Fed targets a 2% inflation rate over time so for a 30-year horizon, investors are willing to accept negative real returns. We think that is unattractive, whereas growth businesses should be able to generate much higher returns over that same time horizon.
EXHIBIT 3: WIDE DISPERSION OF RETURNS AMONG STYLES AND SIZE
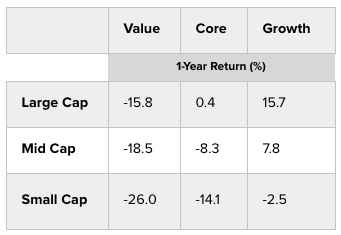
Source: Factset, as of 07/10/2020. Past performance is not a guarantee of future results.
Risk assets have broadly rallied, and the second quarter saw lower quality segments of the market leading the way, in a manner we believe is unsustainable. We do expect to see continued leadership around high-quality business models, which have delivered more consistent rather than cyclically extreme results. The current environment of haves and have nots in terms of the economic and business performance is highly suited to active investing where we pick our spots based on fundamentals, business models, management, leadership and valuation.
The current second quarter corporate earnings season is illustrative of the value of a long-term view. We are encouraged to see business leaders looking beyond the short term to articulate long-term value add for their clients as the path forward to driving shareholder value. Businesses with favorable cash flow and balance sheet characteristics will continue to be advantaged by being able to look beyond the short-term challenges.
Mitigation efforts have helped, but we believe science will be the solution
As the number of confirmed new cases of COVID-19 moved higher, countries responded with mitigation efforts to slow the spread and flatten the curve of infections. The response in the U.S. was less effective in quickly and cumulatively lowering the pace of new infections and deaths compared to other countries. Germany responded with a centralized lockdown and ample testing capacity, while South Korea was prepared with a combination of technology and testing capacity.
Both countries were successful in aggressively flattening the curve. While the curve did not flatten in the U.S. as quickly as experts had hoped, the curve flattened to the point where the U.S. health care system was not overwhelmed. We can consider this a mild success as it buttressed market confidence in the initial U.S. response to the crisis. However, we should also recognize the execution of public health measures during this crisis in the U.S. have fallen short of peer nations as measured by infection rates and mortality.
EXHIBIT 4: HOW DIFFERENT COUNTRIES BENT THE CURVE
New cases of COVID-19 infection
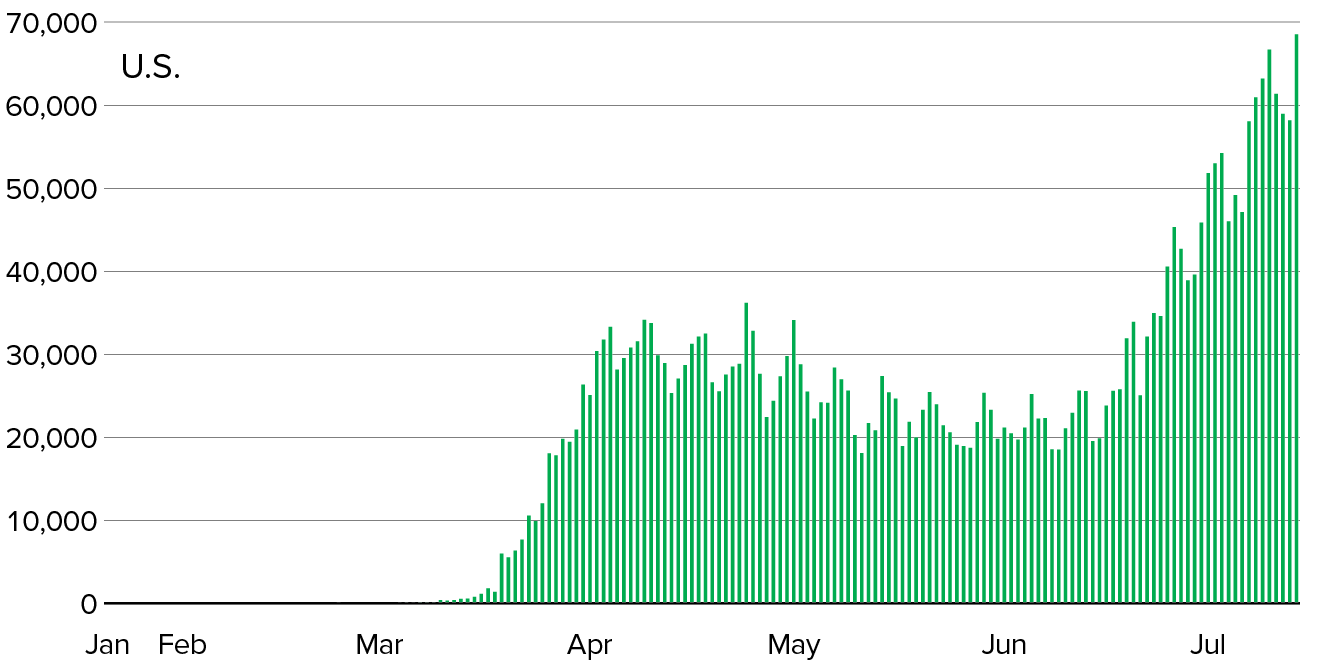
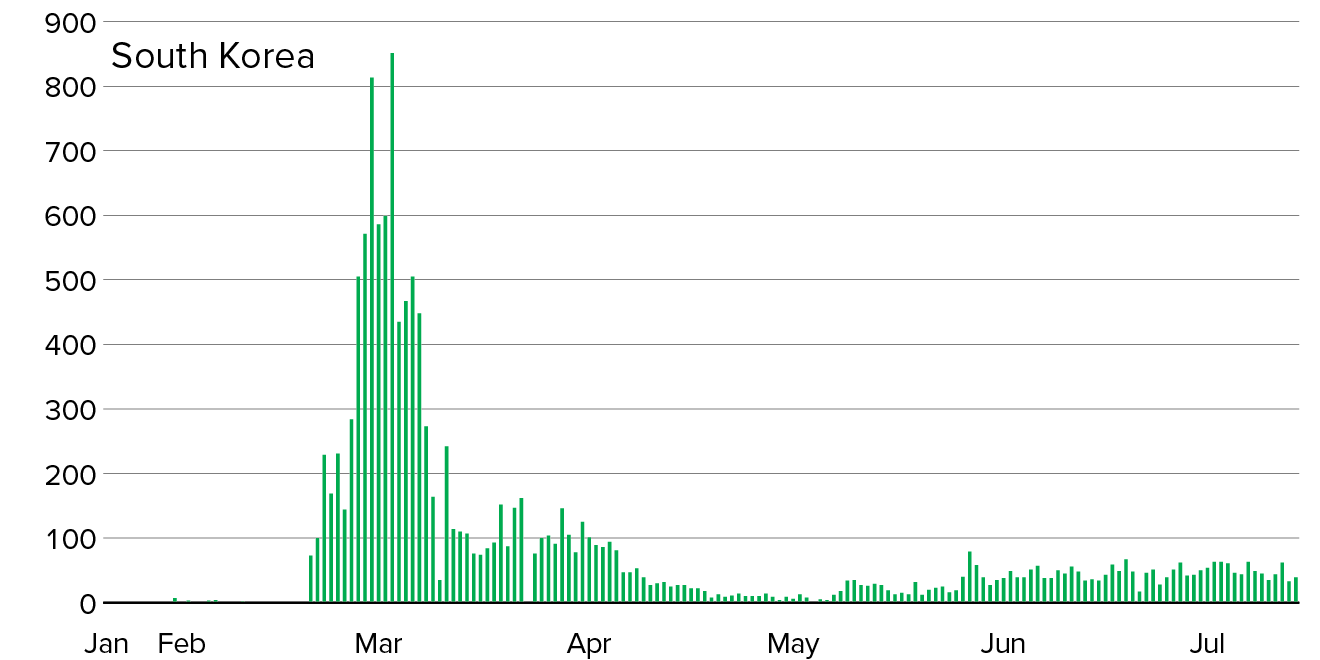
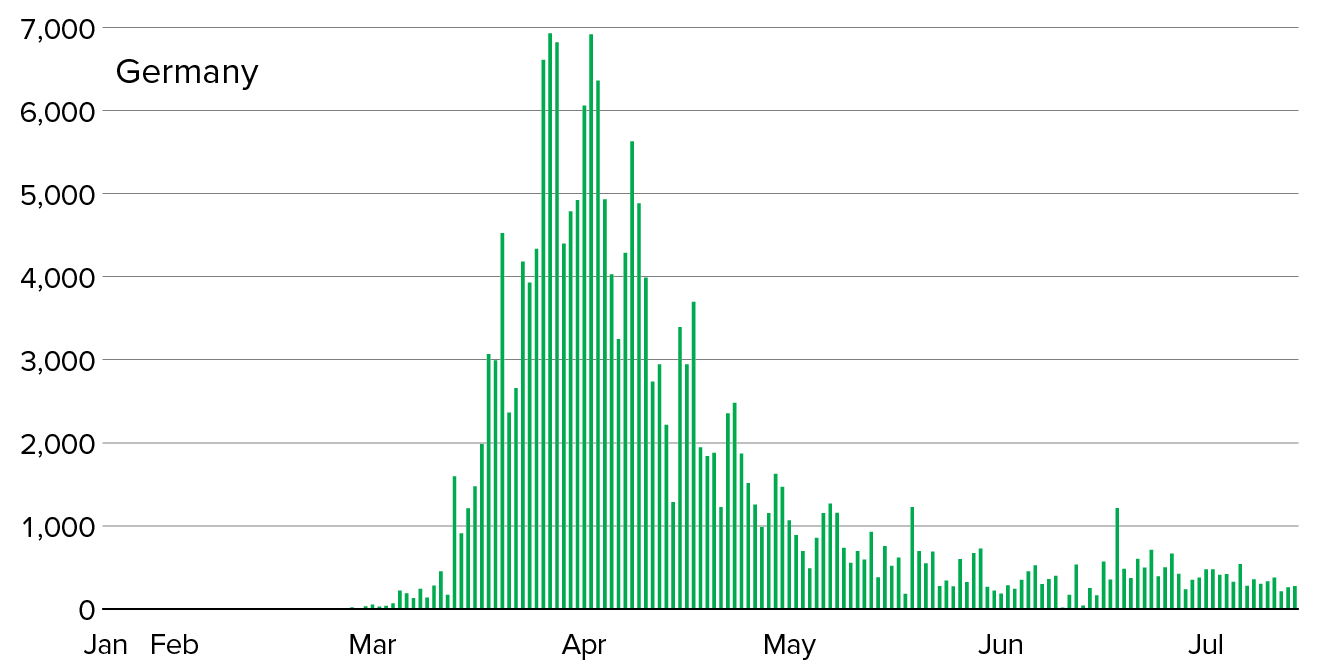
Source Bloomberg. Data show the number of COVID-19 infections recorded through 07/10/2020. Data show the recorded number of COVID-19 infections in the U.S., South Korea and Germany through 07/10/2020. Total cases fluctuate by country.
Even as the U.S. continues to grapple with the uncertainty of the first wave, there are continuing concerns about whether we will have a second wave of COVID-19 infections later this year. While we continue to set new records for infections as we enter the second half of the year, we now have more tools at our disposal to better manage the spread of the virus than we did several months ago. These tools include more testing with better, more accurate results.
We have also seen the recent approval of an anti-viral drug by the Food and Drug Administration, which may help save lives. Companies and municipalities are enacting social distancing policies to limit mass gatherings and encouraging people to wear masks in public places. Our ability to follow possible disease spread through contact tracing is much improved over the early days of the pandemic. And finally, we have science.
Globally, there are over 150 vaccine candidates in development as of mid-2020.
Ultimately, the goal is to find an effective vaccine. Globally, there are over 150 vaccine candidates in development as of mid-2020. More than 10 of these candidates currently are in clinical trials, with some of the most promising listed below. Many of the candidates incorporate new technologies. These novel approaches could be ideal in this situation because their development and manufacturing timelines are extremely streamlined.
We also see traditional technologies under investigation, which is important as the new technologies carry higher risk because they have not previously been approved and used in humans. At the same time, there is a considerable ramp up of manufacturing capacity going on, which is incredibly important.
EXHIBIT 5: A ROBUST PIPELINE OF VACCINE CANDIDATES
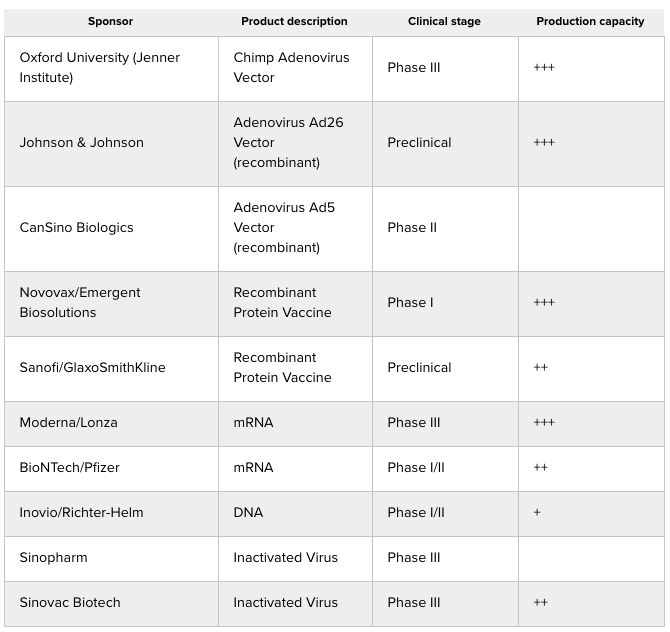
Source: Company reports, WHO, CEPI, Wells Fargo Securities, LLC estimates
Over the next several months, these candidates will move through clinical trials. We believe there is a good chance we are going to have enough human safety and antibody response data by fall 2020 to vaccinate some high-risk populations in the event we see sustained high levels of new infections or a second wave. Furthermore, we believe there could be vaccines for use in the broader population in the first half of 2021, assuming some of the current candidates are successful in preventing infection or reducing the severity of disease in Phase III trials. The next several months are going to be challenging, but we are on the right path forward.
EXHIBIT 6: EXTRAORDINARY DECLINE IN GLOBAL ACTIVITY
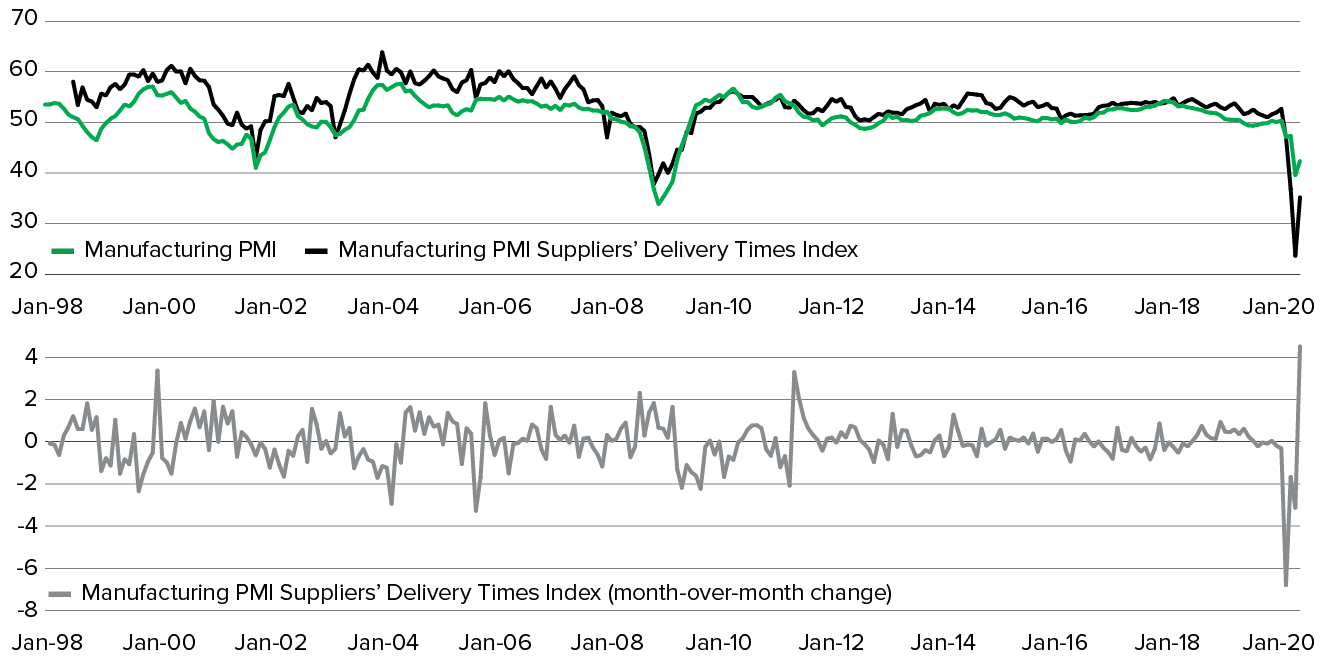
Source: Ivy Investments, Macrobond. Data show the measure times for suppliers to deliver goods to end users and the month-to-month disparity in deliveries. Past performance is not a guarantee of future results.
Exceptional measures to meet an unprecedented challenge
Economic activity fell sharply in the first half of 2020. Indices incorporating a broad array of countries and industries reported the recent downturn has exceeded the lows during the global financial crisis. In turn, employment has been decimated. In addition, data showed delays in delivery times for materials, though the stress has started to abate.
At the same time, the global policy stimulus has been massive. The monetary policy response has been broader and more rapid than at any other time in history. Global central banks have enacted aggressive stimulus through lower interest rates, quantitative easing (QE) and liquidity provisions, with some developing countries implementing QE for the first time.
The Fed’s response has been the strongest with a broad array of policy measures including an unprecedented pace of QE. In addition, the Fed has expanded its purchases beyond the Treasury and mortgage-backed securities (MBS) it bought during earlier rounds of QE and is now buying new types of bonds, including corporate debt and high-yield ETFs. The Fed has also rolled out a program of direct lending. We believe it is unlikely the Fed will raise short-term interest rates for several years and could introduce yield caps on the shorter part of the yield curve to emphasize its easy stance. Global short-term interest rates will likely stay extremely low as well.
EXHIBIT 7: AN UNPRECEDENTED POLICY RESPONSE
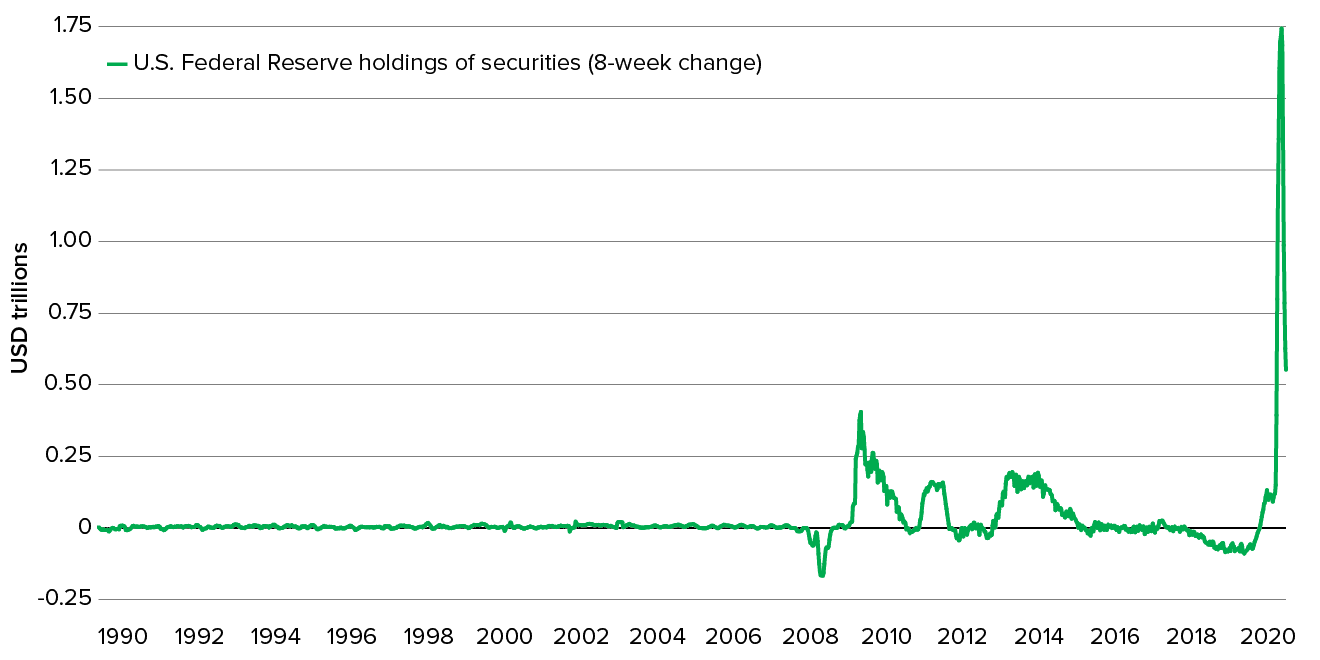
Source: Ivy Investments, Macrobond. Data shows amount of U.S. Federal Reserve holdings of securities (1990 – June 2020)
Just as global central banks are acting aggressively, governments around the world are responding with fiscal stimulus. While projected budget deficits for many countries are huge, those figures include loans designed to keep companies afloat and people employed, a portion of which will be paid back at some point. Up to this point, the fiscal impulse for most major countries is between 5 and 10% of gross domestic product (GDP). This is extremely aggressive both in size and speed of implementation, as we have only been facing this pandemic for a few months. More global fiscal stimulus seems probable. We expect another large fiscal stimulus in the U.S. to become law within the month, which will likely include some form of extension to unemployment benefits and provide aid to state and local governments. Stimulus out of Europe is pivoting from help for business to boosting the consumer, with some countries starting to focus on reducing the value-added tax (VAT) rate. The European Union is debating a “recovery fund” that would provide a mix of grants and loans to the countries most impacted by COVID-19. China has been boosting infrastructure investment and has dramatically increased the flow of credit into the economy.
While the global policy response was not enough to prevent economic weakness, it should allow for a quick recovery. Global GDP likely saw a record decline in the first half of 2020. However, we do expect a relatively strong recovery from here even as the virus still circulates. The reason is base effects. Many businesses had very little revenue for six to eight weeks. As countries have started to reopen, activity has begun to recover. Absolute levels of activity in many industries are likely to continue to be weak, but the base effect should result in a large increase in GDP. In fact, we already see this in corporate guidance and recent data such as Google’s mobility indices, which aggregates people’s location by geography and activity.
Case count patterns we are seeing as of mid-July warrant some caution, as the recovery could be tempered by the recent rise in new COVID-19 cases. We recognize the stubbornly high case count puts at risk the path to opening up and the impact on confidence could reduce consumer spending for a time. Overall, the recovery should be uneven as society figures out how to live with COVID-19, with the absolute level of activity still relatively muted. Bankruptcies are increasing at a rapid pace, which should keep unemployment at a high level relative to where it was prior to the COVID-19 outbreak. We believe it could take until late 2021 at the earliest to get back to pre-virus levels of economic output.
EXHIBIT 8: SPIKE IN BANKRUPTCIES SHOULD WEIGH ON EMPLOYMENT
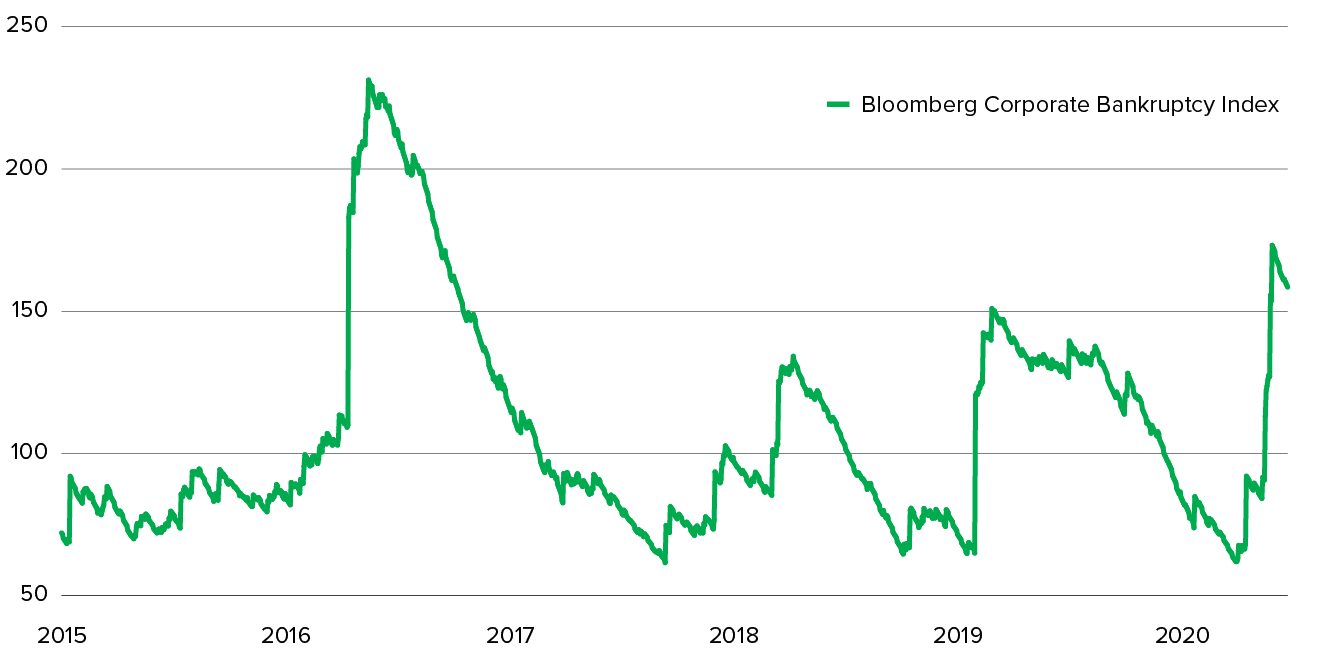
Source: Ivy Investments, Macrobond. The Bloomberg Corporate Bankruptcy Index measures both the occurrence and severity of current and recent U.S. bankruptcy activity for corporations with at least $100 million in reported liabilities. Past performance is not a guarantee of future results.
There is some concern that the extraordinary monetary and fiscal stimulus could lead to a surge in inflation. We believe that it will take time for the tremendous disinflationary impact of the demand shock we experienced to cycle through the economy. In addition, the expected high level of unemployment is yet another headwind to inflation. We think we are at least a couple of years away from seeing inflation starting to get momentum.
The U.S. elections in November are another wildcard. While it is too early to predict an outcome, the election has clear economic consequences. A Democratic sweep would likely result in big changes to the tax code and regulatory environment. While companies have shown the ability over time to adapt to different environments, the short-term impact could be negative. In addition, we could see an introduction of polices that would benefit lower income households at the expense of higher income households. Conversely, a divided result or Republican sweep would likely see a continuation of the positive corporate environment, but could perpetuate the wide income and wealth disparities between households.
The geopolitical outlook could be skewed by the elections as well. President Donald Trump has introduced an isolationist policy, backing away from long-held alliances with other countries. If Democrat nominee Joe Biden wins the presidential election, he will likely try to reestablish those alliances.
Sentiment towards China has clearly shifted on both sides of the aisle. Regardless of who wins the election, we believe that U.S. policymakers will continue to attempt to slow China’s economic, technological and military advances. Over the long-term, action against China could be more impactful under a Biden presidency, as he is more likely to build a global coalition to take on China versus President Trump’s go-it-alone strategy.
High corporate debt levels leave credit markets vulnerable to a shakeout
EXHIBIT 9: CORPORATE LEVERAGE WAS HIGH BEFORE THE COVID-19 CRISIS HIT
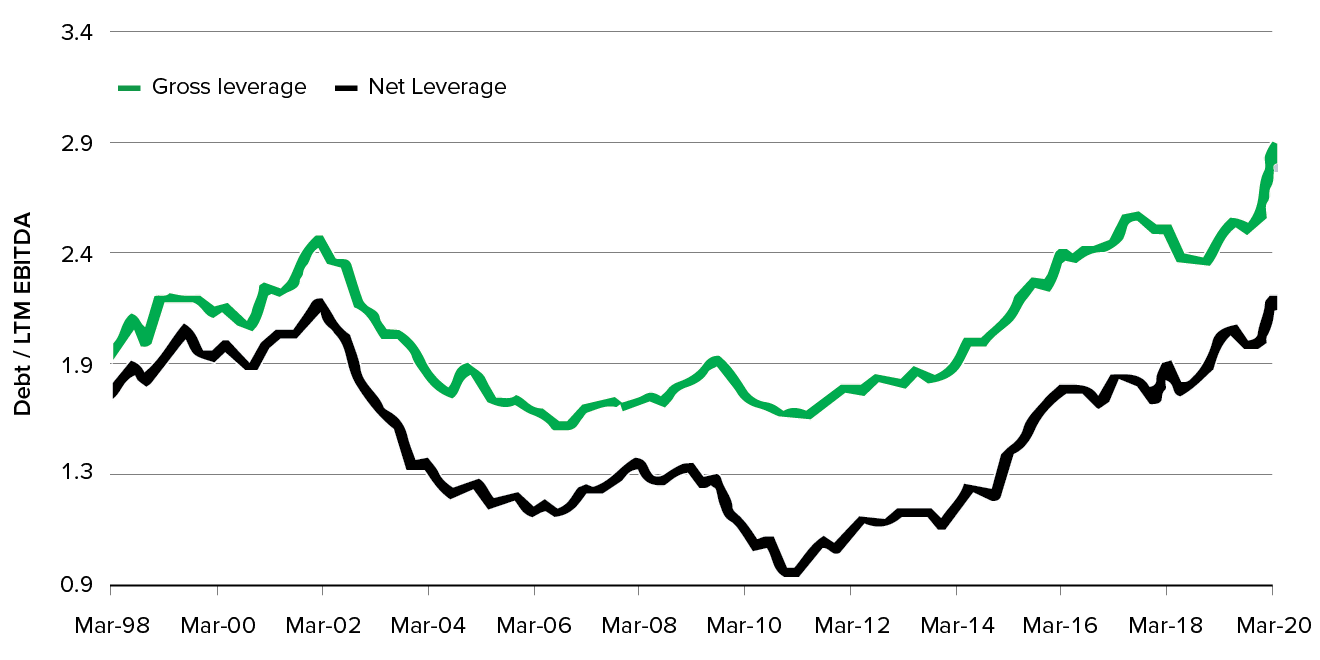
Source: Bank of America Global Research. Past performance is not a guarantee of future results.
While no one could have predicted the pandemic a year ago, what was apparent at that point was that imbalances were building in the credit markets. Investment-grade leverage prior to COVID-19 was already near similar levels seen at the trough of the early 2000s recession. Many other data points indicate the level of imbalances, most notably BBB-grade — the lowest investment grade securities — as a percentage of the investment grade market has doubled over the last 30 years to 50%. The excesses extend across all leveraged finance, including both high yield and loans. Leveraged buyouts and other highly-leveraged companies have gotten progressively more levered. The trend in covenant-lite loans, which have fewer protections for lenders, has grown from nearly zero fifteen years ago to around 80% of the loan market.
EXHIBIT 10: AN ENTIRE CREDIT CYCLE IN FOUR MONTHS
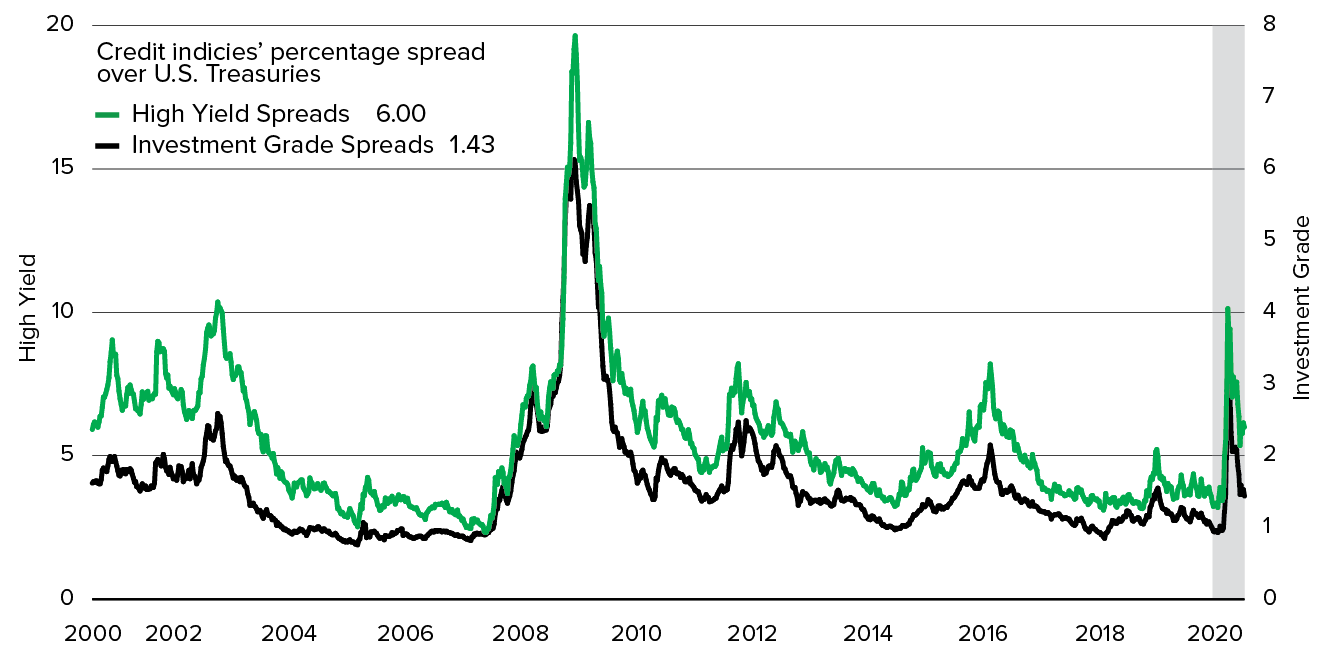
Source: Bloomberg. Past performance is not a guarantee of future results.
This year we saw dramatic re-pricing of risk starting in March when the pandemic began unfolding. This rapid re-pricing virtually shut down the debt capital markets and if left unchecked could have resulted in a historic level of downgrades and defaults. Treasury yields declined to their lowest level ever, and corporate credit spreads in both high yield and investment grade hit levels that we have not seen since the global financial crisis.
It was not just the magnitude of the moves, but also the speed both on the way up and then the partial correction on the way back down. (See Exhibit 10.) Aggressive actions by the Fed were the driving force behind the market bounce. From restarting QE to slashing interest rates to zero, the U.S. central bank quickly helped unlock capital markets.
Market intervention by the Fed also has an impact on the economy. If companies can refinance, they will not default. Ultimately, without the huge amount of stimulus we have seen, the default rate would have been dramatically higher. During an average recession, the spread on investment grade is well over 200 basis points (bps). As of July 10, investment-grade spreads have declined to 143 bps, so fiscal and monetary policy seems to have been effective in limiting the damage to credit markets. Support is not without cost. We risk seeing an increase in zombie firms as that support could result in a misallocation of capital.
EXHIBIT 11: CREDIT SELECTION IS PARAMOUNT AS DEFAULTS INCREASE
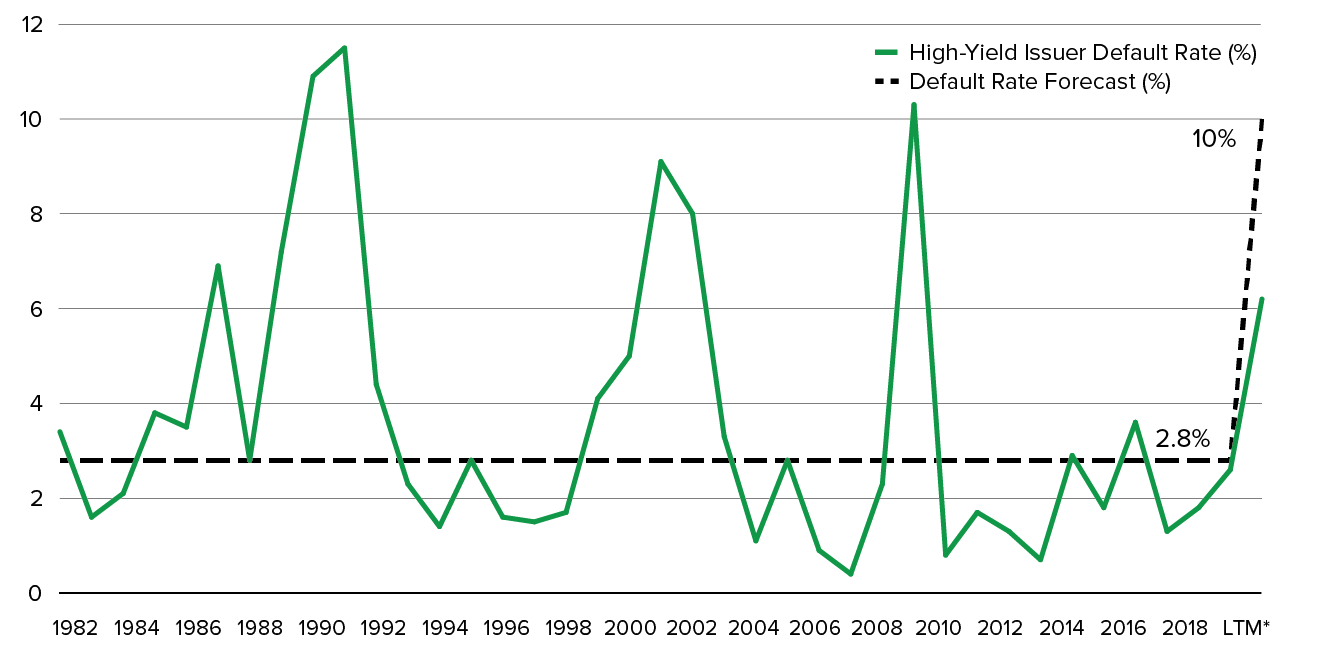
* Last 12 months (as of June 30, 2020). Source: Credit Suisse, JPMorgan Chase & Co. Past performance is not a guarantee of future results.
The extra issuance of credit securities should shore up balance sheets and liquidity but will ultimately need to be repaid. The trend towards debt repayment at the expense of share repurchases has implications for relative value and asset prices as well as for economic growth. Companies are cutting capital expenditures, share repurchases, wages and employment to shore up balance sheets from the extra leverage they had preceding this crisis, as well as the extra leverage accumulated since.
The trend towards debt repayment at the expense of share repurchases has implications for relative value and asset prices as well as for economic growth.
Fiscal deficits relative to GDP are at their highest levels since World War II, leading to record Treasury issuance in the second quarter alone. At some point, this bill also must be repaid, which will hinder future economic growth in the form of higher taxes and lower spending on the government side. In addition, sovereign bond issuance, which is also happening globally, could crowd out other sectors in the markets as the markets absorb this. While QE is happening to offset this, there’s still a large net supply of Treasury and sovereign debt the market needs to absorb.
Policy action has compressed the current credit cycle, but this action cannot fully stop downgrades or defaults. We have already seen a record number of companies downgraded from investment grade to high yield. We believe default rates will increase materially this year.
Investors should also look at recovery rates. The increasing popularity of covenant light loans could be an issue, as these loans are harder to trigger default but also have lower recovery rates. In the coming months and perhaps years, we could see a wave of downgrades and defaults, which will result in enormous dispersion of returns in the credit market. We believe digging into fundamentals and balance sheets matters more than ratings at this point. We project range-bound spreads from here, but the real value is in credit selection.
EXHIBIT 12: RETURNS VARY GREATLY ACROSS ASSET CLASSES AND STYLE FACTORS
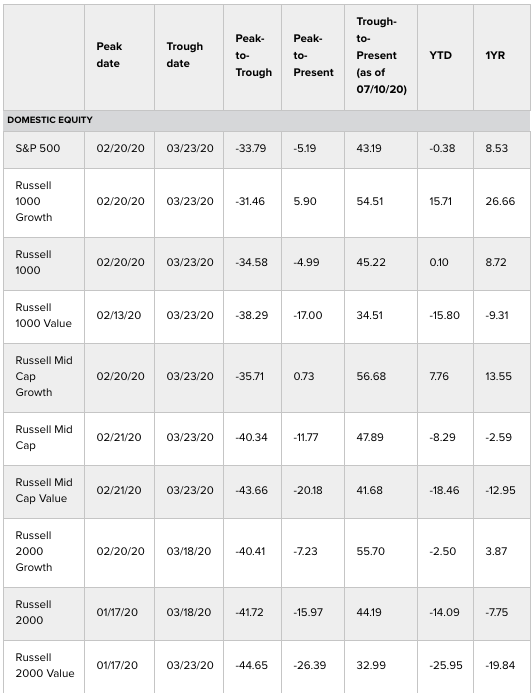
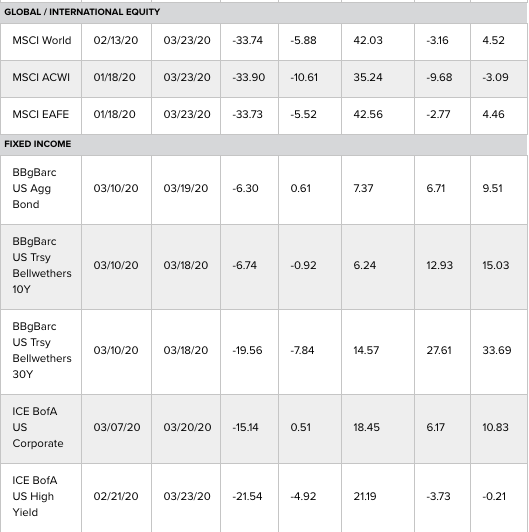
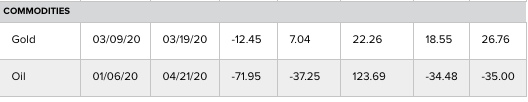
Source: Morningstar and Ivy Investments. Data also show performance of multiple asset class indexes on year-to-date basis as of July 10, 2020 and peak-to-trough bases. Past performance is not a guarantee of future results.
The opinions expressed in this article are those of Ivy Investment Management Company and are not meant to predict or project the future performance of any investment product. The opinions are subject to change at any time based on market and other current conditions, and no forecasts can be guaranteed. This commentary is being provided as a general source of information and is not intended as a recommendation to purchase, sell, or hold any specific security or to engage in any investment strategy. Investment decisions should always be made based on an investor’s specific objectives, financial needs, risk tolerance and time horizon.
The S&P 500® Index is a float-adjusted market capitalization weighted index that measures the large-capitalization U.S. equity market. The Russell 1000® Index is a subset of the Russell 3000® and includes approximately 1,000 of the smallest securities based on a combination of their market cap and current index membership. The Russell 1000® Growth Index is a float-adjusted market capitalization weighted index that measures the performance of the large-cap growth segment of the U.S. equity universe. The Russell 1000® Index is a float-adjusted market capitalization weighted index that measures the performance of the small-cap segment of the U.S. equity universe. The Russell 1000® Value Index is a float-adjusted market capitalization weighted index that measures the performance of the large-cap value segment of the U.S. equity universe. The Russell Midcap® Growth Index is a float-adjusted market capitalization weighted index that measures the performance of the mid-cap growth segment of the U.S. equity universe. It includes those Russell Midcap® Index companies with higher price-to-book ratios and higher forecasted growth values. The Russell Midcap® Index is a float-adjusted market capitalization weighted index that measures the performance of the mid-cap segment of the U.S. equity universe. The Russell Midcap® Value Index is a float-adjusted market capitalization weighted index that measures the performance of the mid-cap value segment of the U.S. equity universe. The Russell 2000® Index is a float-adjusted market capitalization weighted index that measures the performance of the small-cap segment of the U.S. equity universe. The Russell 2000® Index is a subset of the Russell 3000® and includes approximately 2,000 of the smallest securities based on a combination of their market cap and current index membership. The Russell 2000® Growth Index is a float-adjusted market capitalization weighted index that measures the performance of the small-cap growth segment of the U.S. equity universe. The Russell 2000® Value Index is a float-adjusted market capitalization weighted index that measures the performance of the small-cap value segment of the U.S. equity universe. The MSCI World Index captures large and mid cap representation across developed markets countries. The index covers approximately 85% of the free float-adjusted market capitalization in each country. The MSCI ACWI Index captures large and mid cap representation across developed markets and emerging markets countries. The MSCI EAFE Index is an equity index which captures large and mid cap representation across developed markets countries around the world, excluding the US and Canada. The Bloomberg Barclays US Aggregate Bond Index measures the investment grade, U.S. dollar-denominated, fixed-rate taxable bond market and includes Treasuries, government-related and corporate securities, as well as mortgage-backed, asset-backed and commercial mortgage-backed securities. The Bloomberg Barclays 10-Year U.S. Treasury Bellwethers Index is a universe of Treasury bonds with a maturity of less than 10 years, and used as a benchmark against the market for long-term maturity fixed-income securities. The index assumes reinvestment of all distributions and interest payments. The Bloomberg Barclays 30-Year U.S. Treasury Bellwethers Index is a universe of Treasury bonds with a maturity of less than 30 years, and used as a benchmark against the market for long-term maturity fixed-income securities. The index assumes reinvestment of all distributions and interest payments. The ICE Bank of America U.S. High Yield Index is a market capitalization weighted index that tracks the performance of U.S. dollar-denominated below-investment-grade corporate debt publicly issued in the U.S. domestic market. The ICE Bank of America U.S. Corporate Index is a market capitalization weighted index that tracks the performance of U.S. dollar-denominated investment-grade corporate debt publicly issued in the U.S. domestic market. It is not possible to invest directly in an index. The ICE Brent Crude futures contract is a based on the Electronic futures, Exchange of futures for physical delivery contract with an option to cash settle. The spot gold price refers to the real-time Gold Spot U.S. dollars per Troy Ounce price at which gold may be bought and sold.
Standard deviation is a quantity calculated to indicate the extent of deviation for a group as a whole which can be used as a measure of how volatile a fund’s returns are. The US Treasury yield curve is a graphical representation of the yields available for bonds of equal credit quality and different maturity dates.
Risk Factors: Investment return and principal value will fluctuate and it is possible to lose money by investing. International investing involves additional risks, including currency fluctuations, political or economic conditions affecting the foreign country, and differences in accounting standards and foreign regulations. These risks are magnified in emerging markets. Fixed income securities are subject to interest rate risk and, as such, the value of such securities may fall as interest rates rise. Investing in below investment grade securities may carry a greater risk of nonpayment of interest or principal than higher-rated bonds.
© Ivy Investment Management Company. All rights reserved
Membership required
Membership is now required to use this feature. To learn more:
View Membership BenefitsSponsored Content
Upcoming Virtual Events View All


