An Analysis of SPACs and What to Look for in 2021
A Year for the SPAC ages
The combination of an easier process and the flexibility of being able to thoroughly assess investment opportunities before deploying capital has made SPACs (Special Purpose Acquisition Company) popular with both investors and companies looking to go public. The former are finding interesting opportunities that may be considered unicorns in the traditional IPO sense, while the latter see SPACs as a quick and easy way to raise capital and go public. Some of the benefits and features of SPACs came to light in 2020, as a record number of SPACs went public and a few companies that used a SPAC to go public generated triple digit returns for investors. As we head into 2021, opinions vary on whether SPACs are reaching a saturation point and some well-known investors are suggesting they shouldn’t even be legal. I won’t get into that debate here but there are benefits to the SPAC model and with their current trend seemingly continuing, I wouldn’t urge investors to ignore them but certainly suggest they do their due diligence before diving in.
History
Despite their recent popularity, SPACs had a short history of fraud in the 1990s that gave them a bad reputation and very likely caused their popularity to fluctuate over the next two decades.
SPACs had been around for a long time, and SPAC activity was modest but steady until the dot-com mania, when traditional IPOs became the preferred choice for going public. It wasn’t until 2003, several years after the bubble burst that SPACs started becoming popular again, as the remnants of the dot-com bubble faded away. In 2007, activity reached 66 IPOs that raised $12.1 billion, according to SPAC Analytics, only for SPAC activity to largely disappear again in 2008 – the year of the Great Recession.
Fast forward to 2010, and private equity firms started becoming frequent sponsors for SPACs, a natural extension of the activities these firms normally partake in with the capital they raise in traditional Private Equity (PE) funds. These PE funds, some very well-known and highly successful, lent credibility to SPACs and a steady flow of SPAC activity began.
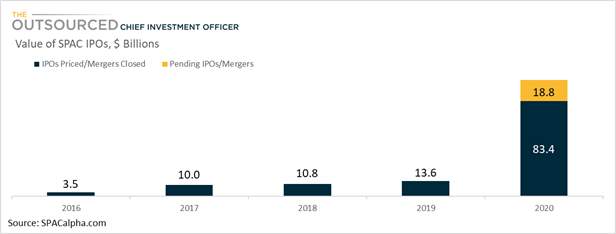
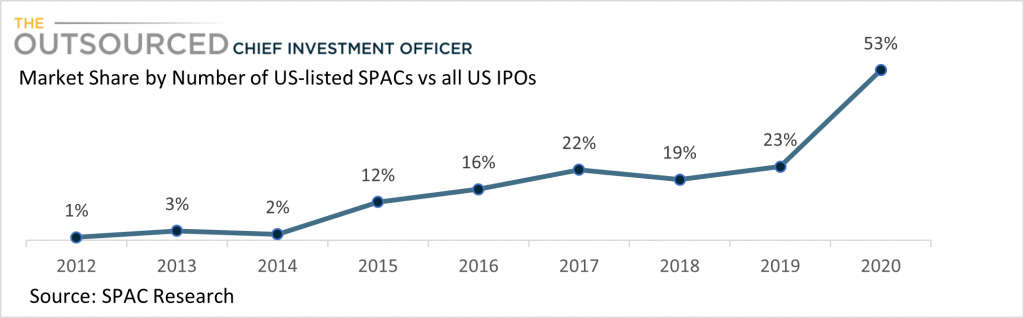
SPAC IPO activity was on a healthy upward trend from 2016 to 2019, when there were 59 SPAC IPOs that raised over $13 billion. That resulted in SPAC IPO activity reaching 23% market share of all IPOs, the highest recorded to that point. But the level of activity in 2020 was unprecedented, as SPAC IPOs jumped to 329.
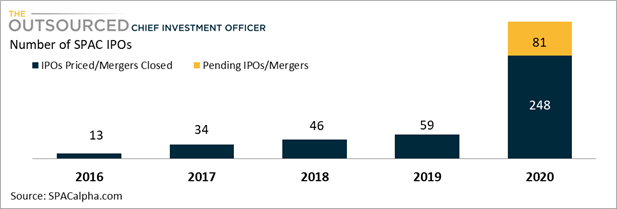
SPAC activity in 2020 led to $19 billion of business combinations and another $83 billion still in search of a target company as of December 31st.
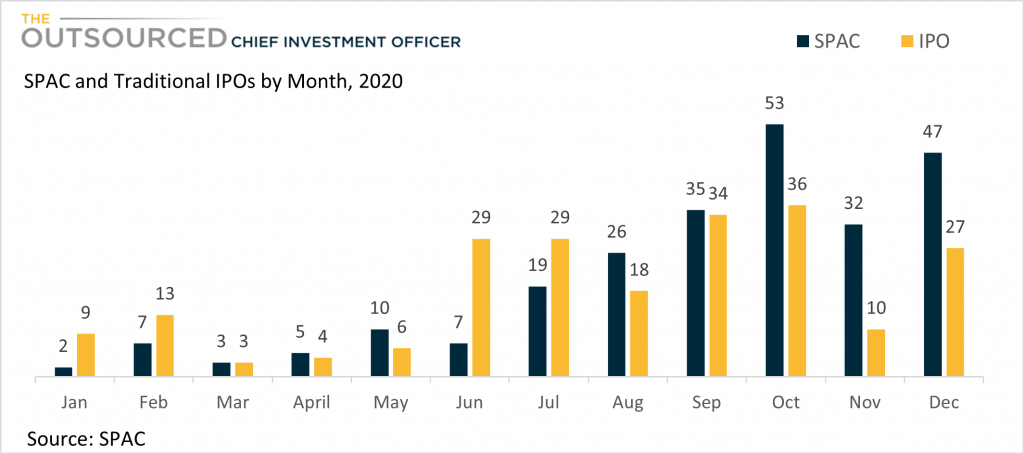
Market share of SPAC IPO reached 53%, and the trend for companies to go public through SPACs will likely continue well into 2021. A look at the activity towards the end of 2021 shows an accelerating trend in the number of SPACs towards the end of the year, with 133 SPACs going public in Q4 alone. (see second chart below) As of January 11th, 2021, another 28 SPACs have launched and 75 have filed for IPO – a rate that if maintained would easily surpass the record activity of 2020.
For investors interested in IPOs, Private Equity, or similar investments, SPACs provide an opportunity to pick and choose which companies to invest in, even though the initial investment in a ‘blank-check’ company does not provide any information on what company the SPAC would eventually acquire. This feature, or option, is thanks to the redemption rights provided by SPACs, which I will discuss below.
SPAC Process from IPO to De-SPAC
A SPAC IPO is similar to a traditional IPO in that they both are offering securities to the public. They also both involve SEC registration and disclosures and the shares are listed on an exchange. But with a traditional IPO, investors at least know the company they are investing in and can perform due diligence, while with a SPAC, they are “blindly’ relying on the sponsors to identify acquisition targets and determine the fair value of those acquisitions as well as structuring and negotiating a deal.
Some SPACs focus on acquiring a target in a particular industry while others have no specific focus and perform a wider search looking for opportunities wherever it may find them. Those that do focus on a specific industry, however, may have management with significant experience and reputations in those industries.
Once capital is raised, the IPO proceeds are deposited into a trust account awaiting the identification of an acquisition target. When a target company is identified, a shareholder vote is required, and upon approval, the cash from the IPO and any additional debt issued is used to acquire a minority or controlling stake in the target company –– rendering the newly acquired company a publicly traded entity.
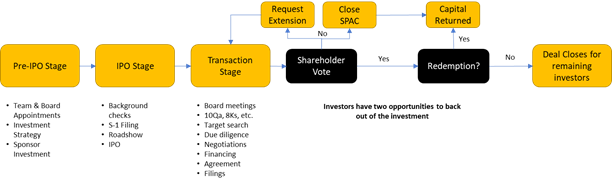
A more detailed look at the process is shown below. The Pre-IPO and IPO stage look identical to that of a traditional IPO, including S-1 filings and a roadshow to spark interest in the offering. Once public, however, the SPAC, which up to this point had no operations, begins its search for a target company, maintaining financials, tax filings, and conducting regular board meetings.
SPACs issue units, which consist of one share of common stock and a fraction of a warrant to purchase additional shares in the future. The SEC requires at least 90% of the funds raised through the IPO to be kept in a trust account through the date of acquisition.
The SPAC then has 24 months to identify a target company. Once a target company is identified, sponsors perform due diligence and negotiations, structure and obtain financing, and once there is a binding agreement, file 8Ks and proxies.
If the target company is approved by shareholders, the process for deal consummation moves forward. However, investors have a second opportunity at this point to exercise their redemption rights if they do not feel the deal is in their best interest. Investors who opt-out are returned their capital, plus interest, while all remaining investors remain in the SPAC until the transaction closes. This feature gives investors a way out not found in traditional private equity fund investments.
For all their work, SPAC sponsors usually are compensated by founder shares that convert into public shares during the de-SPAC transaction as well as warrants that can be converted to shares at specified share prices. This compensation, referred to as the promote, often represents as much as 20% of the value of a SPAC’s post-IPO common shares. Note that the “promote”, which does not exist for traditional IPOs, could be dilutive to shareholders.
Lastly, sponsors must usually hold the equity for a year after the business combination although share price outperformance can allow the lock up to expire early.
Investing in SPACs vs. Private Equity Funds
Investors interested in investing in SPACs should understand some of the pros and cons and compare some of their features with both traditional IPOs as well as venture capital and private equity funds. For starters, the decision to invest in a SPAC vs a Private Equity fund shouldn’t necessarily be an either/or decision. If appropriate for the investment objectives of the investor, investments in both SPACs and PE funds can be used together in a portfolio provided the allocation and timing can be properly implemented. Even though both types of investments are made before knowing which companies the fund manager or sponsor will invest in, the approach to each will differ based on their respective characteristics.
For example, PE funds have an investment duration of 7-8 years and sometimes can be extended for another 1-2 years. This means liquidity is constrained and investors have no control over how the capital is invested. In other words, the PE fund manager doesn’t require investor approval for each transaction.
Compare that to a SPAC, where the investor can sell their shares in the open market before an acquisition target has been identified, vote for or against an identified target company, or redeem their investment before a deal is completed. And even if an investor stays invested through the entire process, the investment duration could be only 2-3 years. In a PE fund, on the other hand, once you have committed capital, even if the capital hasn’t been called, there could be steep penalties for reneging.
As for fees, while there is a 1-2% fee on committed capital on PE funds, there is no such fee for SPACs, although the performance fee of 20% typically charged by PE funds is similar to the 20% share of the IPO proceeds that accrue to the sponsor in a SPAC.
One benefit for investors provided by a PE fund that is not shared by a SPAC is that a PE fund provides diversification, even if the fund is entirely focused on a specific sector or industry. A PE fund might invest in anywhere from 10-20 companies or more, whereas a SPAC is only invested in one company (sometimes two). For investors, therefore, the challenge with a strategy to invest in SPACs is the difficulty in finding enough opportunities to achieve proper diversification within a portfolio.
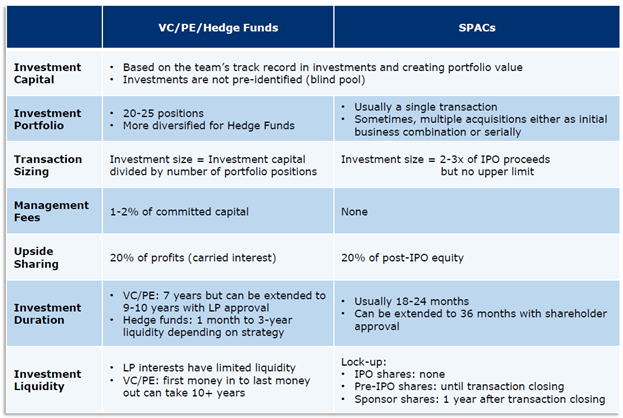
Source: SPAC Alpha
A Review of Performance
The media’s focus on SPACs with spectacular returns belies the potential return of SPACs in general. In fact, a report by the Congressional Research Service states,
In the past, SPACs had a reputation for underperforming traditional IPOs and other market benchmarks. Performance records, however, are mixed. Some industry research reportedly shows that, for the SPACs that completed de-SPAC transactions between 2015 and July 2020, their shares delivered an average loss of 18.8%. That compares with the average after-market return from traditional IPOs of 37.2% since 2015. University of Florida finance professor Jay Ritter calculates that from 2010 to 2017, SPACs underperformed the broader market by about 3% annually in the first three years after their IPOs. He attributes that underperformance to the period of time when the cash was in escrow accounts returning low interest rates while the market was rising. Other Bloomberg analysis shows that since 2017, SPACs have more closely tracked traditional IPO performance, especially for the larger SPAC IPOs. Each SPAC is different, and the industry is still evolving. As such, case-by-case analysis could also be important.
We can break down SPACs into categories to gather some insight into what to look for in a SPAC when evaluating an investment. With the caveat that historical performance is not indicative of future returns, the data shows that larger SPACs have produced the highest returns. SPAC IPOs in excess of $400M have outperformed all other sizes by roughly 5% annualized since 2015. The reason for this is unclear but could be driven by the fact that only reputable firms with strong prior performance history are able to raise large amounts of capital from investors.
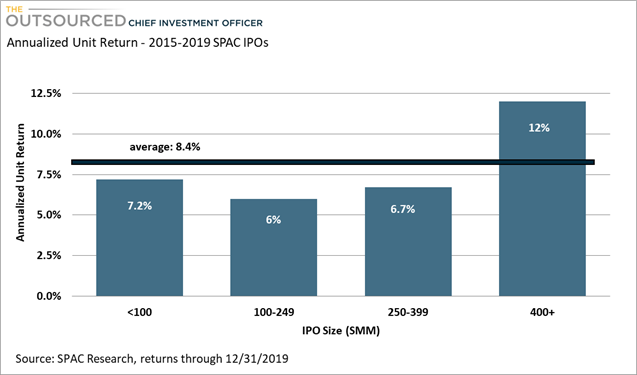
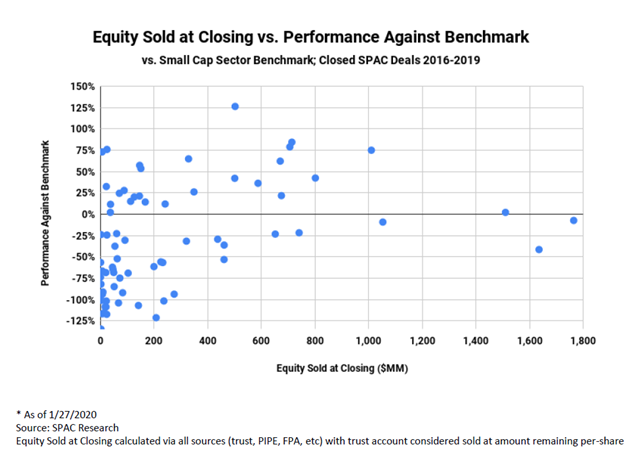
Investors should therefore be considering the size of the SPAC when investing both because larger SPACs have tended to outperform but also because they are usually led by high quality sponsors. For investors interested in smaller SPACs, be aware that even though SPACs under $100MM were the second-best performing category, a large concentration of smaller SPACs significantly underperformed relative to the small cap sector benchmark – note the high level of concentration towards the bottom left of the chart below.
Another criteria to consider when evaluating the potential return of a SPAC is the attributes of the sponsor. A report by McKinsey revealed that one year after taking a target public, operator-led SPACs traded about 10% higher than their sector index and about 40% higher than other SPACs. Operator-led is defined by those whose leadership has former C-suite experience in the specific sector or industry, versus sponsors who solely have financial or investing experience.
Lastly, we could also compare SPAC performance within certain sectors to the ETF equivalent for each sector to set expectations for performance relative to publicly traded companies within each sector. In the charts that follow, I compare the performance of several De-SPAC Sector Indices provided in a report by Duff and Phelps, with the returns of the comparable Select Sector SPDR ETFs.
According to Duff & Phelps, the De-SPAC Technology Index outperformed other SPAC sector indices with a return of 73% through the end of September, followed by Industrials with a 49% return. The De-SPAC Energy Index lagged all others with a return of -61%.
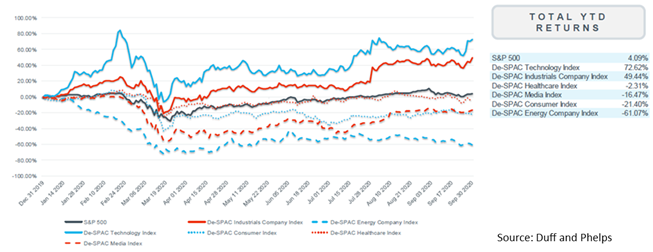
Comparing these returns to the returns of the Select Sector SPDR ETFs that correspond to each sector, we can see that performance is only similar for Technology and Energy, whose respective ETFs were also the best and worst performers, respectively.
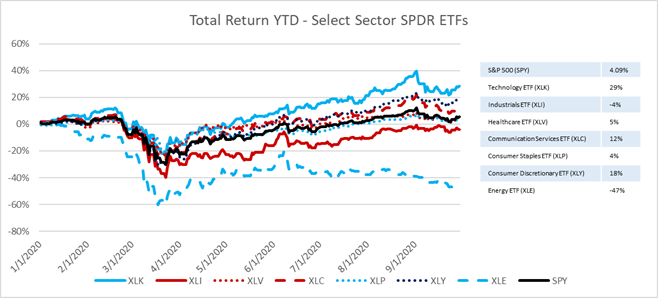
Overall, SPACs performed directionally similar to the publicly traded ETFs, as the sharp decline in early 2009 in both charts was followed by a steady increase through the end of the year. To some extent this might be surprising because SPACs are, after all, shell companies with no operations. However, it’s not so surprising in that investors may be looking through at each SPACs eventual target company sector and driving the price of the SPACs as sector outlooks change. What’s interesting in this analysis is that investors may have actually benefitted from diversification by investing in both a SPAC and ETF within the same sector. For example, the Industrials ETF was down 4% but the SPAC Industrials index was up 49%. Meanwhile, the SPAC Consumer Index was down 21%, while the Consumer Staples and Consumer Discretionary ETFs were up 4% and 18%, respectively.
A Few Examples
There were several highly touted SPACs this year, two of which completed their business combination this year and generated attractive returns for investors. But the route they took throughout the year is indicative of the highly uncertain and volatile potential share price fluctuations of SPACs pre and post-transaction.
- DraftKings, the online betting platform that has been legalized in many states during the pandemic was up 335% in 2020 as a result of the merger with the SPAC, Diamond Eagle Acquisition.
- Nikola, on the other hand, was up a solid 48% in 2020, which was great for early investors, but at one point the stock was up 580% before it dropped. It merged with the SPAC VectoIQ Acquisition Corp and proceeded to spike on the excitement of electric trucks, but when the hype died down and investors realized the CEO was exaggerating (to say the least) potential, the stock reversed course. Any investor who bought in June 2020 would have lost 65% of their investment by the end of the year.
- Pershing Square Tontine Holdings (PSTH), which started trading in mid-2020, was up 38% by December 31st and it still has not announced an acquisition target. It is being sponsored by Pershing Square and Bill Ackman, a very well-known and successful investor.
- You also have lesser-known SPACs, like Alusssa Energy Acquisition Corp (ALUS) which went public in January 2020 at a price of $10 and was trading at $10.25 by the end of the year – a mere 2.5%. Investors didn’t lose money but the opportunity cost of not being invested in the S&P 500, for example, was over 13%.
Of the SPACs that went public in prior years, only 26 have liquidated out of 116 that have filed for an IPO between 2009 and 2019. The success and failure of all of those SPACs that DID merge or acquire another company is beyond the scope of what I can cover here but returns are not as spectacular as some of 2020s best performers, according to SPAC Insider.
Breaking Down An S-1: Pershing Square Tontine Holdings
Investors looking to invest in a SPAC should ensure they perform their due diligence by thoroughly reviewing the S-1 filing before investing. I’ll briefly review some of the features and characteristics of Pershing Square Tontine Holdings (PSTH) to walk you through some of the specific information to look for in the 200 page document.
- Sponsor – Anyone can start a SPAC so it’s important to understand who the sponsor is of each SPAC and their capabilities and previous success investing or if they are former C-suite executives, their success in running a company. Pershing Square is a well-known hedge fund led by Bill Ackman, a well-known investor. Mr. Ackman hasn’t always been right on his concentrated and well-publicized investments, but he has been very successful providing outsized returns for investors through the Pershing Square funds. Pershing Square was established in 2003, and had approximately $10.3 billion of assets under management as of June 30, 2020.
Pershing Square also served as co-sponsor of Justice Holdings, Ltd., which is the only SPAC that Pershing Square has previously sponsored or co-sponsored. Justice Holdings raised $1.5 billion in its initial public offering (including a $458 million investment by Pershing Square), and subsequently merged with Burger King Worldwide Inc., and later, Tim Hortons, to form Restaurant Brands International Inc. It now trades publicly and has a market cap of $19 billion. It generated a compound annual total return of 19% since its merger with Justice Holdings, Ltd. in 2012 (as of June 30, 2020).
- Offering
- Proposed Units and the Shares and Warrants they represent – most SPACs issue units that include shares and warrants that are exercisable at a specific price. Knowing what you’re investing in and the thresholds that the share price needs to surpass for the warrants to be worth something is important. PSTH units consist of one share of Class A Common Stock and one-ninth of one warrant. Another two-ninths of one warrant will be distributable to remaining shareholders per the Tontine warrants described below.
- Price per share – most SPACs issue shares at $10 per share but PSTH issued shares at $20.
- Size of raise – PSTH increased it’s raise to $4 Billion and since target company values are usually 2-3x the IPO raise, we can estimate the target company to be somewhere in the $8 billion to $12 billion market capitalization.
- Tontine Warrants – if you’re wondering about the name of this SPAC, it includes the word Tontine to describe that some of the warrants will be distributed pro-rata to remaining shareholders after the initial business combination. Any investors that redeem their investment will forfeit those warrants to investors that stay invested. This is a big incentive to reward those who remain invested until the business combination occurs.
- Exercise Price and Period of Warrants – in this offering, the exercise price of the warrants is $23 and are excisable up to 12 months after the closing of the IPO offering or 30 days after the completion of the business combination, whichever is later.
- Acquisition Criteria
- Sector Focus, if any? Many SPACs focus on specific industries while others are generalists. PSTH does NOT specify a specific industry so management is free to target companies in any industry.
- In the offering memo, the company describes the following criteria within their search for a target company:
- Simple, predictable, and free-cash-flow-generative, with current positive cash flow or a high probability of positive cash flow in the near future;
- Formidable barriers to entry or ‘wide moats’;
- Companies that are not materially affected by macroeconomic factors, commodity prices, regulatory risks, interest rate volatility and/or cyclical risk;
- Companies that are conservatively financed relative to their free-cash-flow generation, after taking into consideration the de-leveraging effects of the initial business combination;
- Companies that can benefit from being a public company with broader access to the capital markets and greater governance, but will prefer companies that are not highly reliant on the capital markets to operate and grow their businesses;
- Companies with large enterprise values and significant long-term growth potential that will be likely candidates for inclusion in the S&P 500 index;
- Companies at an attractive valuation relative to their long-term intrinsic value; and
- Companies that have trustworthy, talented, experienced, and highly competent management teams. These companies may be led by entrepreneurs who are looking for a partner with our expertise to execute on the next stage of their growth.
- Management and/or Other Investment Professionals – it goes without saying that management and investment professionals of the sponsor are extremely important, whether they have had prior success within the industry the SPAC is targeting or in previous investment transactions of private companies. In this case, Pershing Square has had considerable experience in the private equity world and in active participation in public companies through their concentrated investments in these firms.
- Risk Factors – most S-1’s will have boilerplate risk language such as:
- We are a newly formed company with no operating history and no revenues, and you have no basis on which to evaluate our ability to achieve our business objective.
- Past performance by Pershing Square, Justice Holdings, Ltd. or our Management Team may not be indicative of future performance of an investment in us.
But be on the lookout for any other risks mentioned that are specific to the offering.
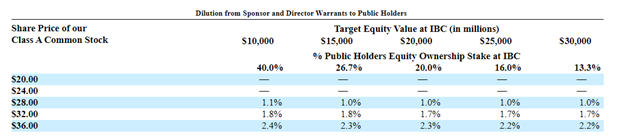
- Example of Pct Ownership post De-SPAC
- PSTH provides the following example: If the target company is valued at $10.0 billion and the Market Price is $20.00, the $4,000,000,000 represented by the shares of Class A Common Stock sold in the offering gives the Public Owners an ownership stake of 40.0% in the post-combination business, whether or not the Sponsor Warrants exist (as none of the warrants are exercisable at this Market Price). At a Market Price of $36.00, the Public Owners have an ownership stake of 42.3% (reflecting exercise of their Redeemable Warrants), without taking into account the Sponsor Warrants and Director Warrants. By including the Sponsor Warrants and Director Warrants, their ownership stake decreases to 41.3%. The dilutive effect, calculated as the 1.0% decline in ownership stake, divided by 42.3%, is 2.4%.
- If the target company is valued at $25.0 billion and the Market Price is $20.00, the $4,000,000,000 represented by the shares of Class A Common Stock sold in the offering gives the Public Owners an ownership stake of 16.0% in the post-combination business, whether or not the Sponsor Warrants exist (as none of the warrants are exercisable at this Market Price). At a Market Price of $36.00, the Public Owners have an ownership stake of 17.5% (reflecting exercise of their Redeemable Warrants), absent the Private Holders. Including the Private Holders, their ownership stake decreases to 17.1%. The dilutive effect, calculated as the 0.4% decline in ownership stake, divided by 17.5%, is 2.2%.
As shown below, the size of ownership stake of all of pre-combination stockholders and warrant holders decreases proportionately with a larger deal size. However, the dilutive effect does not vary significantly with deal size.
How to Think about an Asset Allocation Strategy
Finding SPACs Pre-IPO is not much different than finding traditional IPOs. Investors have to be aware of new offerings and/or monitor S-1 filings and there are a number of websites that provide alerts. However, like traditional IPOs, most retail investors will find it very difficult to get an allocation of any units as most go to institutional investors. Retail investors will likely have to wait until the IPO and purchase shares in the open market.
The good news is that because there is no operating company, a dramatic price spike on the first day of trading is highly unlikely. The more likely scenario is a slight increase in the stock price if the sponsor is highly reputable and has had previous investment success.
An additional question I get when investors or advisors are evaluating SPACs is how to incorporate the SPAC into an asset allocation or model portfolio. When you consider the funds will sit idle until a deal is completed, it could throw off targeted allocations over the short-term, especially if you consider the SPAC has considerable latitude in the type of company it can acquire, whether it’s a small cap or large cap company or the sector and industry the company operates in.
One way to ‘allocate’ these type of investments by market cap is to consider that targets are usually valued at 2-3 times the amount of the raise. So a $1 billion raise might result in an acquisition target with a market value of $3 billion to $4 billion. Or if looking at an allocation within a particular sector, investors can limit their SPAC investments to operators within certain sectors, which also tend to outperform SPACs with a more general target.
Here are some additional tips on an asset allocation approach:
- Implement a process similar to that of a PE asset allocation. For example, a target PE allocation of 20% should realistically be a targeted committed capital of 25%-30% considering those funds aren’t always 100% invested and before it is, PE firms usually begin to return capital. An over allocation measured by committed capital would more likely result in achieving the target actual allocation over time. The same might apply to SPACs, except that most of the time, a SPAC investment will be held in cash – so be mindful of that.
- Lean towards sponsors with more specific targets, allowing you to better understand how the investments will be allocated once a business combination occurs or how the share price of the SPAC might trade relative to the performance of it’s ETF cousin.
- Spread out investments across multiple IPO years similarly to how investors should be spreading out Private Equity investments across vintage years.
- Prioritize larger SPACs. Although some smaller SPACs are led by reputable sponsors and could perform well consider allocating a higher percentage of a portfolio to the larger SPACs and reduce position size for smaller SPACs.
- Consider ‘following’ certain sponsors that have had previous success and for which you may already have performed due diligence. This helps by reducing the need to repeatedly perform analysis on new sponsors.
Final Thoughts
These suggestions and ideas should be enough to get investors started in evaluating and investing in SPACs. So far in 2021, it looks like the trend towards SPAC IPOs will continue and could offer investors some interesting opportunities. Just beware that all good things come to and end and in the investment world, participants joining the party late tend to have lower performance than earlier investors. Not that there won’t be other 10 baggers available, but as more and more sponsors launch SPACs, ensure you perform strict due diligence and be mindful of those SPACs launched by celebrities with no prior investment experience, such as Billy Beane, Shaquille O’Neal, Paul Ryan, etc. Unless they are partnering with investment professionals with a track record of success, steer clear of these.
© The Outsourced Chief Investment Officer